Environmental Engineering Reference
In-Depth Information
9.2.6.3 Source Apportionment
The fractional contribution of source
i
to the wet deposition at receptor
j
can be determined
from
Q
i
T
ij
i
S
ij
=
(9.29)
Q
i
T
ij
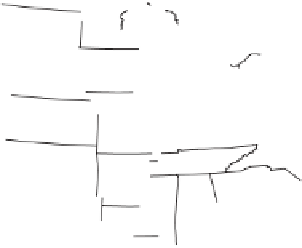
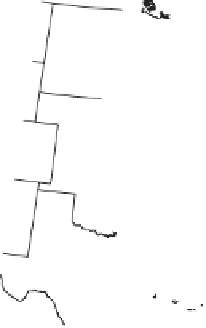
where the summation is over all contributing sources. This is illustrated in Figure 9.13, which
shows the contribution (%) of 31 eastern U.S. states and several subprovinces of Canada to the wet
sulfate deposition in the Adirondack region of New York. The percent contribution is dependent on
(a) the emission rate of SO
2
in a particular state and (b) the transfer coefficients between the states
and the Adirondacks. The high SO
2
emitting states of Pennsylvania, Ohio, West Virginia, Indiana,
and New York are the largest contributors to Adirondack sulfate deposition. By coincidence, these
states also lie upwind of the Adirondacks. A significant portion of lakes in the Adirondacks have
been acidified, probably due to acid deposition.
Thus, acid deposition models, as the one described above, could be used for “targeted” emission
reduction strategies, wherein those sources that contribute most to acid deposition to a sensitive area
would curtail their emissions to a greater extent than those sources that contribute little or nothing.
However, by virtue of Title IV of CAAA 1990, the U.S. Congress decided that SO
2
emissions
will be cut by about one-half of 1980 emissions, regardless of the location of a source
vis a vis
a
sensitive area. From a political standpoint, a uniform emission reduction strategy is more expedient
than a targeted strategy, which would pit some states and regions against others.
0.1
0.0
0.1
0.0
5.6
0.5
0.9
0.3
0.1
0.1
0.6
0.3
2.2
4.0
0.0
1.5
7.8
0.7
3.4
2.0
0.5
11.4
0.1
0.1
0.4
0.
2.0
1.7
11.9
3.6
5.3
5.3
0.2
2.3
1.8
3.5
2.6
1.0
3.0
0.1
0.2
2.5
1.8
0.5
1.2
0.5
2.0
Figure 9.13
Contribution (%) by state and province to sulfate deposition at an Adirondack receptor. (Source
is same as in Table 9.6.)