Environmental Engineering Reference
In-Depth Information
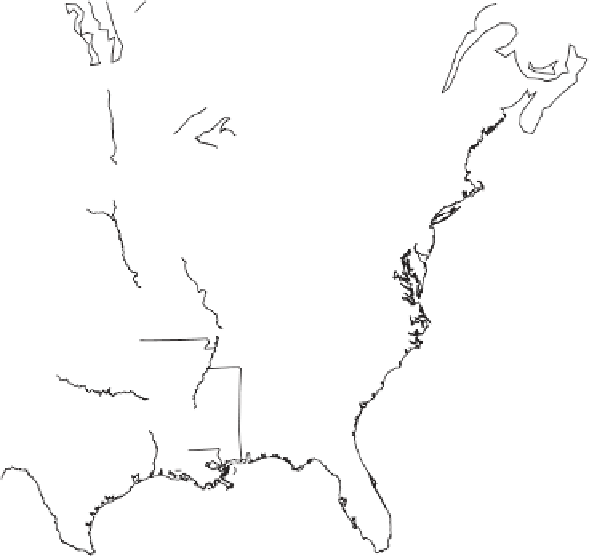
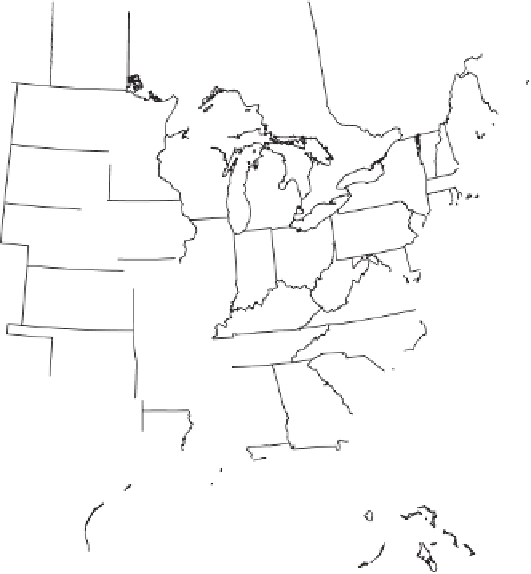
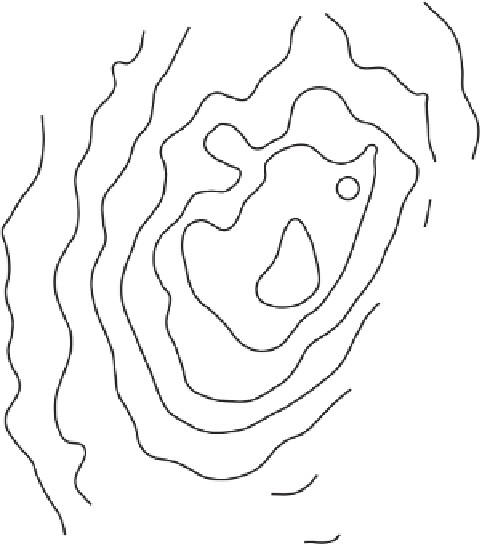
Figure 9.11
Predicted versus observed wet sulfate deposition in ENA (kg SO
2
4
/ha y). (Source is same as in
Table 9.6.)
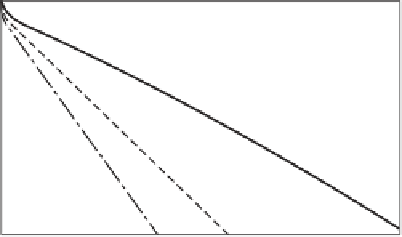
10
-9
(a)
(b)
(c)
10
-10
0
1000
2000
3000
Distance (km)
Figure 9.12
Transfer coefficient as a function of source-receptor distance for source: (a) upwind,
(b) crosswind, and (c) downwind from receptor. (Source is same as in Table 9.6.)