Environmental Engineering Reference
In-Depth Information
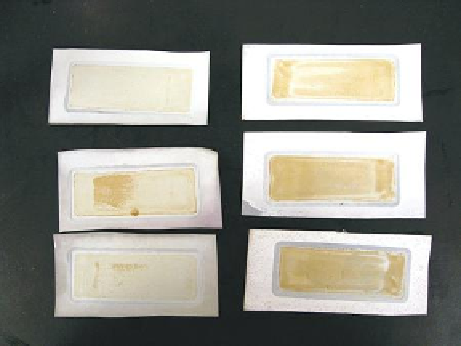
FIGURE 13.2
Comparison of SWRO membrane fouling. Membrane samples on the left side are from NanoH
2
O elements
with NP3, while those on the right are from conventional commercial SWRO. (From J. Green, “Nanocomposite
Reverse Osmosis Membranes,” presentation at 2009 WATER EXECUTIVE Forum, Philadelphia, March 30-31,
2009. Reprinted with author's permission.)
100
90
80
70
60
50
40
30
20
10
0
Physical
Chemical
Biological
68%
12%
37%
14%
24%
3%
15%
3%
Gas-phase deposition
Electron beam lithography
Pulsed laser ablation
Laser-induced pyrolysis
Powder ball milling
Aerosol
11%
21%
19%
15%
Fungi mediated
Bacteria mediated
Protein mediated
20%
10%
27%
Coprecipitation
Microemulsion
Hydrothermal
Electrochemical deposition
Sonochemical
ƒermal decomposition
FIGURE 14.1
Comparison of published work (up to date) on the synthesis of SPIONs by three different routes. (From
Mahmoudi M., Sant S., Wang B. et al.,
Advanced Drug Delivery Reviews
, 63, 24, 2011.)


