Environmental Engineering Reference
In-Depth Information
Figure 16.4 was obtained by placing the active layer against a TEM grid in a petri dish,
and then adding several portions of methylene chloride to dissolve the polysulfone.
Imaging with TEM through the membrane resulted in an image highlighting the loca-
tion where nanoparticles were incorporated in the plane of the membrane. Particle size
distribution (from light scattering) of the solutions used to prepare the membrane reveals
that the nanoparticles used were present in aggregates with an average diameter just over
1 micron. The match in diameters of aggregates in solution and membrane suggests the
aggregates present in solution were subsequently trapped within the forming polymer
layer. Spaces between the nanoparticles in these aggregates are believed to have contrib-
uted to decreased salt rejection for this membrane (Table 16.1).
Improved solution preparation, for instance by increased sonication time and power
(obtainable with a sonic probe), can be used to break up these aggregates. After appro-
priate preparation, the solution used to prepare the membrane in Figure 16.5 had a
mean size measured by light scattering of ~100 nm, the diameter of the nanoparticles as
synthesized.
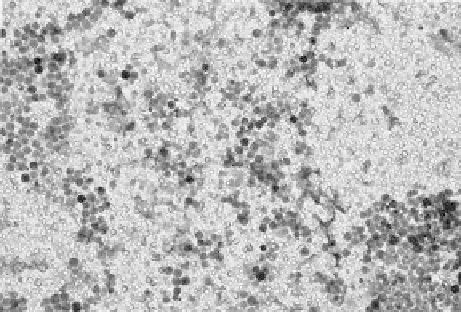
The TEM image of membrane D shown in Figure 16.5 reveals a much improved distri-
bution of nanoparticles; high areal incorporation, few aggregates, and relatively uniform
surface coverage.
Once protocols were established minimizing issues with aggregates, proper selection
of nanoparticle type was found to allow the production of TFN membranes having good
performance (membrane E in Table 16.1). Flux is in gallons per square foot per day (gfd).
With these developments in place, scale up to a continuous manufacturing line was con-
ducted in 2010 and the resulting membrane rolled into conventional spiral-wound modules
known commercially as Qfx membranes. Membrane performance data, using industry-
standard element testing, demonstrates that 20 cm (8-in) Qfx membrane modules with
3 7. 2 m
2
(400 f t
2
) membrane area have industry-leading lux of 51.9 m
3
/day (13,700 gfd) with
salt rejection at industry standards of 99.8%. More recent adjustment of the Qfx chemistry
allowed production of Qfx membranes with salt rejection at 99.85%, signiicantly exceed-
ing industry standards. When compared with membranes with 99.80% salt rejection,
membranes with 99.85% rejection produce 25% better water quality. The higher rejection
FIGURE 16.5
SEM of well-dispersed nanoparticles in membrane D.