Environmental Engineering Reference
In-Depth Information
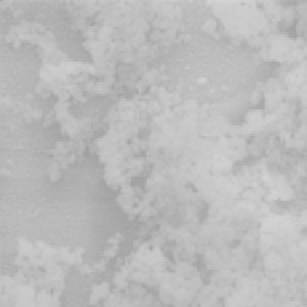
FIGURE 16.3
SEM image of surface-aggregated nanoparticles in membrane B.
TABLE 16.1
Membrane Performance
Membrane
Flux (gfd)
Rejection
A. Control—no nanoparticles
18.9 (±4.1)
99.66 (±0.11%)
B. Surface aggregated nanoparticles
19.5 (±0.42)
99.22 (±0.23%)
C. Smaller incorporated aggregates
25.6 (±1.3)
98.37 (±0.02%)
D. Well-dispersed nanoparticles
27.5 (±0.34)
99.37 (±0.01%)
E. Optimized nanoparticle selection
34.2 (±2.7)
99.65 (±0.01%)
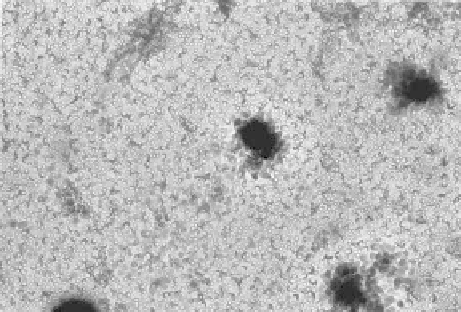
FIGURE 16.4
TEM image of nanoparticle aggregates in membrane C.