Information Technology Reference
In-Depth Information
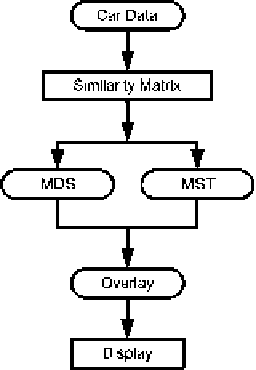
Fig. 3.27
The procedure of
generating an MST-enhanced
MDS map of the CRCARS
data. Nodes are placed by
MDS and MST determines
explicit links
The CRCARS data set includes 406 cases of cars. Each case consists of
information from 8 variables: miles per gallon (MPG), the number of cylinders,
engine displacement in cubic inches, horsepower, vehicle weight in pounds, 0-
60 mph acceleration time in seconds, the last two digits of the year of model, and
the origin of car, i.e. USA as 1, European 2, and Japanese 3. For example, a record
of a BMW 2002 shows that it was made in Europe in 1970, with a 26 mile per gallon
fuel consumption, 4 cylinders, 0-60 mph acceleration in 12.5 s, and so on. The A
procedure of combining MDS and MST is shown in Fig.
3.27
(Basalaj
2001
). The
resultant MDS configuration of 406 cars in the CRCARS data set is reproduced in
Fig.
3.28
.
Figure
3.29
is a procedural diagram of a journal co-citation study (Morris and
example here is to illustrate the use of MDS to map more abstract relationships.
This is also a good example to show that clustering and MDS may result in different
groupings. When it happens, analysts need to investigate further and identify the
nature of discrepancies. Figure
3.30
shows the cluster solution. Each data point is a
journal. Note that the journal “Comput Biol Med” belongs to cluster BIOMEDICAL
COMPUTING, whereas the journal “Int J Clin Monit Comput” belongs to cluster
COMPUTING IN BIOMEDICAL ENGINEERING. In Fig.
3.31
, the results of
clustering are superimposed on top of the MDS configuration. Now see how close
the two journals are located. This example indicates that one should be aware of the
limitations of applying clustering algorithms directly on MDS configurations.
In this example, both MDS and clustering took input directly from the similarity
matrix. This approach has some advantages. For example, between MDS and
Clustering, we might identify patterns that could be overlooked by either method
alone. We will also present an example in which MDS and clustering are done
sequentially. If that is the case, we need to bear in mind we are totally relying on
MDS alone because the subsequent clustering does not bring additional information
into the process.
Search WWH ::

Custom Search