Information Technology Reference
In-Depth Information
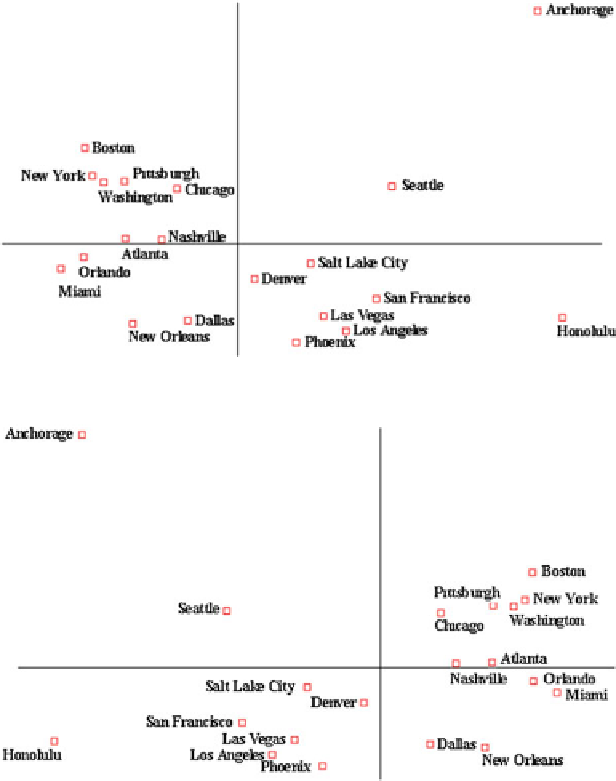
Fig. 3.25
An MDS configuration according to the mileage chart for 20 cities in the US
Fig. 3.26
The mirror image of the original MDS configuration, showing an overall match to the
geographic map, although Orlando, Miami should be placed further down to the South
We input the city distance data to MDS, in this case using ALSCAL in SPSS,
and use Euclidean distance for the model. Figure
3.25
shows the resultant MDS
configuration, which is like a mirror image of the usual geographic map with New
on the right instead of left. We can legitimately rotate and flip an MDS configuration
to suit our custom. If we take the mirror image of the MDS configuration, the result
is indeed very close to the US map (Fig.
3.26
).
Now let us look at a more abstract example, in which each data point represents
a car and the distance between two different cars is measured by a number of per-
formance indicators. This example is based on a widely available multidimensional
data set, the CRCARS data set, prepared by David Donoho and Ernesto Ramos
(
1982
).
Search WWH ::

Custom Search