Java Reference
In-Depth Information
0.5
0.4
0.3
0.2
0.1
Raw Curve
Seasonality
Trend+Residual
0
-0.1
-0.2
-0.3
-0.4
-0.5
Mar-1999
Mar-2000
Mar-2001
Mar-2002
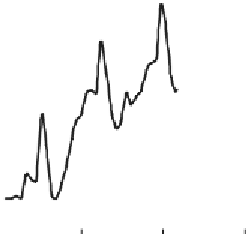
Figure 18-4
Time series decomposition.
0.6
0.5
0.4
0.3
0.2
0.1
Historic
Forecast
0
-0.1
-0.2
-0.3
-0.4
-0.5
Mar-1999
Aug-2000
Dec-2001
Apr-2003
Figure 18-5
Time series forecasting.
the predicted signal value is often accompanied with a confidence
band—a range of values that provides, for example, a 95 percent
confidence of containing the correct outcome. Such confidence
bands are also common in regression mining functions.
18.3
Apply for Association
Recall that the association mining function allows market basket anal-
ysis, producing rules of the form A B, where A is one or more ante-
cedent items, and B is a consequent item (e.g., “Portable DVD Player,


Search WWH ::

Custom Search