Environmental Engineering Reference
In-Depth Information
Rainfall
Hours
after
start
Total
flow
Base
flow
Direct
R.O.
U.G.
ord.
Date
Hour
10
Drainage area =
40 sq mi
Feb.
16
0600
500
500
0
0
0
4
8
10
12
14
1
18
20
22
2
26
28
30
32
34
0800
1000
1200
1400
1600
1800
2000
2200
2400
0200
0400
0600
0800
1000
1200
1400
1600
5600
9200
10100
7800
6600
5550
4700
4000
3300
2700
2300
1950
1650
1400
1200
1000
800
450
400
400
450
450
5150
1120
1915
2110
1600
1340
1100
900
740
590
460
360
280
210
150
100
50
0
8800
9700
7350
6150
5050
4150
3400
2700
2100
1650
1300
950
700
450
250
0
9
8
500
550
600
600
600
650
650
700
700
750
750
800
7
17
Effective duration = 6 h
6
5
59,850
12
=
Direct runoff =
4988 sfd = 4.63 in.
4
Total
59850
3
2
(a)
1
Base flow
Hours:
0600
1200
1800
2400
0600
1200
1800
Feb.16
Feb.17
2000
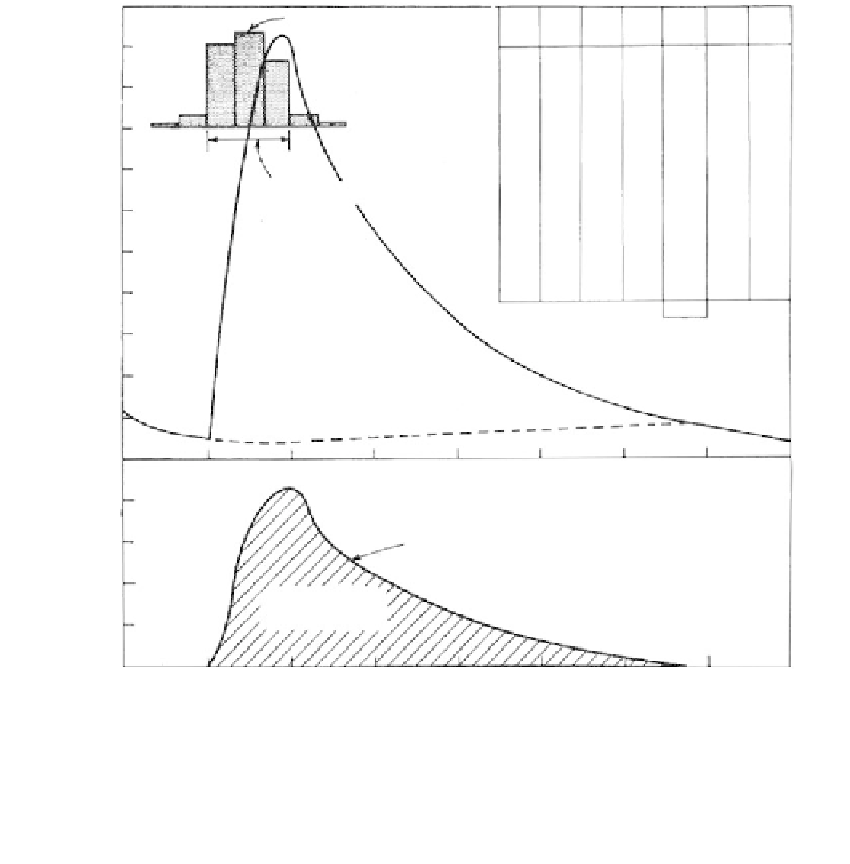
Unit hydrograph
1500
1000
Area = 1 in. of
direct runoff
(b)
500
0
6
12
18
24
30
36
Hours from beginning of runoff
FIGURE 8.13
Development of a unit hydrograph. (From Linsley et al.,
Hydrology for Engineers,
1958. Reprinted with
permission of McGraw-Hill Book Company.)
Geologic Forecasting
The basis of geologic forecasting is the delineation of the floodplain boundaries from ter-
rain analysis (see
Sections 2.2.3
and
7.4.1)
to identify the distribution of recent alluvium or
Quaternary soils in the valley, and to identify erosional features in the valley that are
flood-related. The result can be more accurate than analytical procedures, especially where
long-term rainfall data are lacking, and in any case should always be performed as backup
to analysis. A time cannot be placed on flood recurrence, except for the conclusion that
flooding has occurred in recent geologic history and is likely to return.
Example: Rapid City, South Dakota (Rahn, 1975) On June 9, 1972, a storm dropped 15 in.
(352 mm) of rain on some locations on the slopes of the Black Hills in less than 6 h. The most
intensive rain was seen in a 100 mil
2
area of the basin of Rapid Creek, between the city and
an upstream dam built for flood control. Streams discharged several times the expected
peak discharge and, in the western part of the city where the creek flows into a valley with
a 3000-ft-wide floodplain, residents reported local surges of water 20 ft high. There were at
least 238 deaths. The limits of the flood waters in the city are shown in
Figure 8.15,
as is the
area mapped previously by the USGS on 7
1
2
min quadrangle maps as Quaternary alluvium.
The coincidence is clearly evident. The floodplain area has subsequently been zoned by the