Environmental Engineering Reference
In-Depth Information
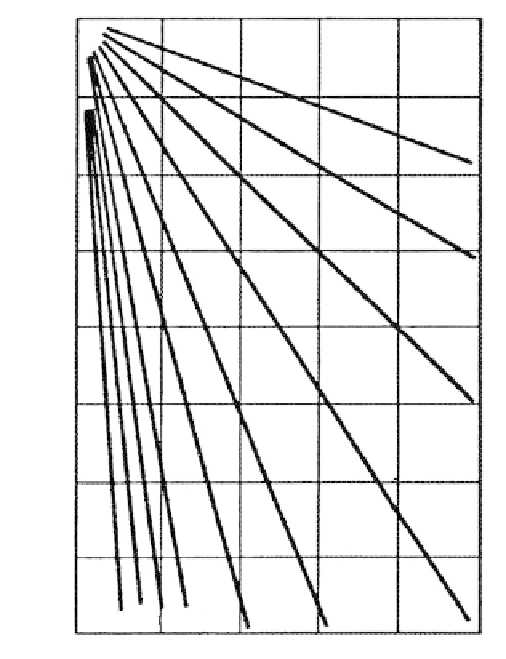
Estimating
φ
Numerous studies have been published for assessing
from the CPT in clean sands.
Robertson and Campanella (1983) reviewed calibration chamber test results to compare
cone resistance to measured peak secant friction angle from drained triaxial compression
tests. The triaxial tests were performed at the confining stress approximately equal to the
horizontal stresses in the calibration chamber before the CPT.
The recommended correlation for uncemented, unaged, moderately compressible, pre-
dominantly quartz sands proposed by Robertson and Campanella (1983) is shown in
Figure 3.61 (Robertson, 2000).
φ
Estimating Undrained Shear Strength s
u
including loading direction, soil anisotropy, strain rate and stress history. Since anisotropy
and strain rate influence the results of all
in situ
tests, their interpretation requires some
empirical measure.
Robertson (2000) gives
s
u
(
q
t
σ
v
)/
N
kt
(3.50)
Cone resistance
q
c
(MPa)
0
0
10
20
30
40
50
50
φ
' = 48
°
100
46
°
150
200
44
°
250
300
42
°
350
FIGURE 3.61
Friction angle,
, from CPT in uncemented
silica sand. (After Robertson, P. K. and
Campanella, R. G.,
Can. Geotech. J
., 20,
718-733, 1983. Permission of National
Research Council of Canada.) (Courtesy of
ConeTec Inc.)
φ
30
°
32
°
34
°
36
°
38
°
40
°
400
1 kg/cm
2
Note
: 0.1 MPa = 100 kPa = 1 bar
≈
1 tsf
≈
1
q
c
tan
φ
' =
log
+ 0.29
2.68
'
vo
σ