Environmental Engineering Reference
In-Depth Information
σ
v
the total overburden pressure at
depth
z
and
N
kt
the depth correction factor varying from 10 to 20.
N
kt
tends to increase with
increasing plasticity and decrease with increasing soil sensitivity. For a more conservative
estimate, higher values of
N
kt
are selected;
N
kt
should be confirmed by other strength tests
for each new location.
where
q
t
is the total cone resistance (
Section 2.3.4),
Correlations between q
c
and SPT N value
Correlations provide approximate values because many factors affect the SPT
N
values
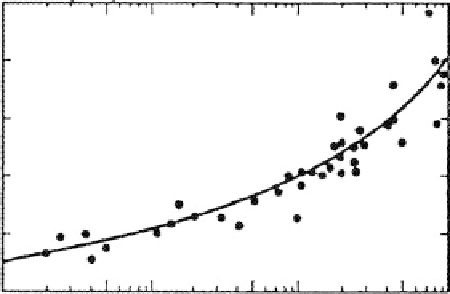
Robertson et al. (1983) proposed the correlations given in Figure 3.62 relating the ratio
q
c
/
N
60
with the mean grain size
D
50
.
N
60
represents an average energy ratio of about 60%,
which reflects the average energy efficiency of the SPT test.
Flat-Plate Dilatometer Test (DMT)
Purpose
Correlations for strength properties are made to provide estimates of
φ
and s
u
.
Deformation property determinations are discussed in
Section 3.5.2.
Test Method
A flat blade with a steel membrane on one face
(Figure 3.63)
is pushed into the ground
using a CPT or drill rig as a reaction. At test depth, the operator inflates the membrane and
applies gas pressure to expand the flat-lying membrane. In about 1 min, two pressure
readings are taken and electronically recorded: A, the pressure required just to begin to
move the membrane; and B, the pressure required to move the center of the membrane.
The blade is then advanced typically for a distance of 20 cm and the test repeated.
The pressure readings A and B are corrected by values determined by calibration to
account for membrane stiffness. Corrected values for A and B are given as
p
0
and
p
1
. These
values are used to define several dilatometer indices:
E
D
34.7(
p
p
1
) (dilatometer index)
(3.51)
K
D
(
p
0
u
0
)/(
σ
v0
) (horizontal stress index)
(3.52)
qc (bars), (1 bar = 100kPa = 1.04 tsf), N(blows/ft)
Clay Clayey silts
Sandy silt
Silty sand
Sand
& silty clay
& silt
10
Data from 18 sites
8
6
4
FIGURE 3.62
CPT-SPT correlations with mean grain
size. Based on an SPT energy ratio of
60% (After Robertson, P. K. and
Campanella, R. G.,
Can. Geotech. J
., 20,
718-733, 1983. Permission of National
Research Council of Canada.)
2
0
0.001
0.01
0.1
1
Mean particle size D
50
(mm)