Environmental Engineering Reference
In-Depth Information
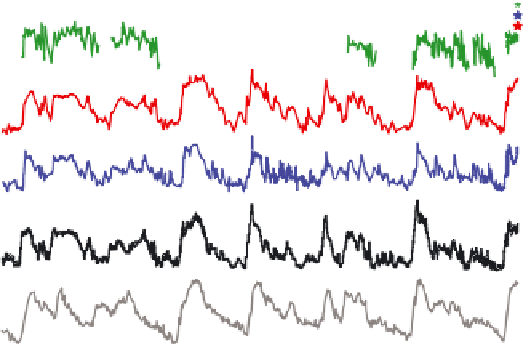
Figure 2.4.13
Ice core measurement
Variations (in thousand years) of deuterium (
δ
D; black), a proxy for local temperature;
δ
18
O marine records (dark grey), a proxy for global ice volume fl uctuations; and the
atmospheric concentrations of the greenhouse gasses CO
2
(red), CH
4
(blue), and nitrous
oxide (N
2
O; green). Data derived from air trapped within ice cores from Antarctica and
from recent atmospheric measurements. The shading indicates the last interglacial
warm periods. Downward trends in the benthic
δ
18
O curve refl ect increasing ice vol-
umes on land. The stars and labels indicate atmospheric concentrations in 2000.
Figure
from IPCC, reproduced with permission
[2.2].
Is this excess of CO
2
caused by human activity? This question has
also been studied extensively, and several methods demonstrate that the
answer is “yes.” For example, in the atmosphere the ratio of heavy to
light carbon isotopes (Carbon-13 versus Carbon-12) is different from that
of fossil fuels. Why? Fossil fuels come from plant matter, and the chem-
istry of photosynthesis in plants results in a lower effi ciency of
13
C incor-
poration into the plant compared to
12
C. Thus our fossil fuels are slightly
depleted of
13
C. When we combust fossil fuels, then, we should reduce
the
13
C:
12
C ratio in the atmosphere. Indeed, experiments have shown
that the decline of atmospheric
13
C levels is perfectly correlated with the
increase in CO
2
levels (see
Figure 2.4.15
).
Another example of how we know that the current increase in atmos-
pheric CO
2
is from anthropogenic activity comes from analyses of the


Search WWH ::

Custom Search