Environmental Engineering Reference
In-Depth Information
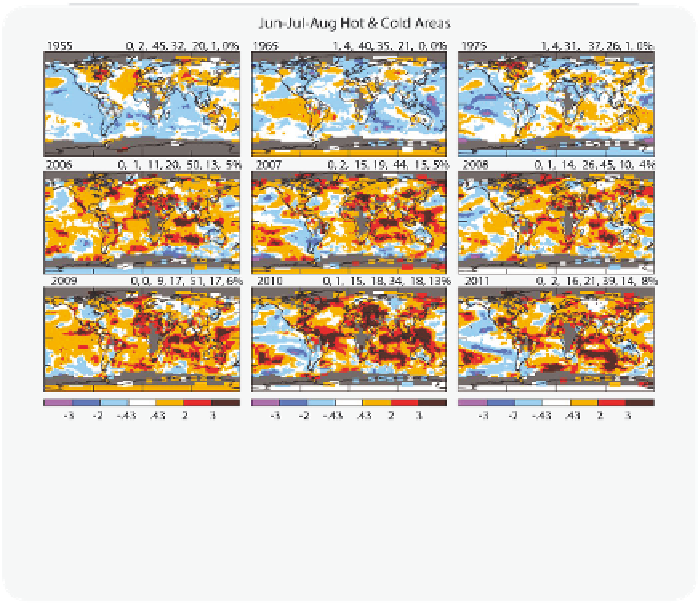
Figure 2.4.11
Surface temperature anomalies
June-July-August surface temperature anomalies over Northern Hemisphere land in 1955,
1965, 1975, and 2006-2011 relative to a 1951-1980 base period in units of standard devia-
tion. Numbers above each map show the percent of surface area covered by each cate-
gory in the color bar. Brown and purple represent extreme warm and cold weather.
Figure
from Hansen et al., with permission
[2.11].
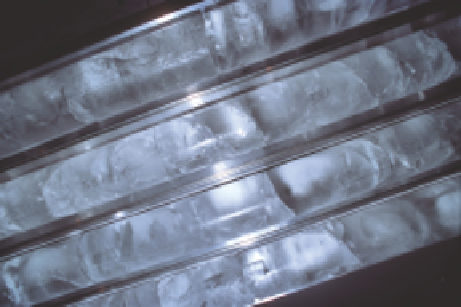
Figure 2.4.12
Example of an ice core
Image by Guillaume Dargaud, with permission.


Search WWH ::

Custom Search