Environmental Engineering Reference
In-Depth Information
Distance (meters)
Offset (meters)
0 30
Injection
Well
Monitor
Well
0 10 20 30
1400
1505
1420
1440
1460
1480
1530
1500
1520
1540
1550
CO
2
plume
1560
Change in velocity (km/s)
-1.0 -0.5 0.0 0.5 1.0
(a)
(b)
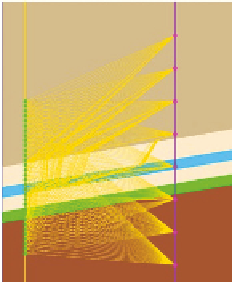
Figure 10.5.5
Seismic receiving and monitoring
(a) Sketch of seismic receivers, sources, and hypothetical seismic ray paths at the Frio
CO
2
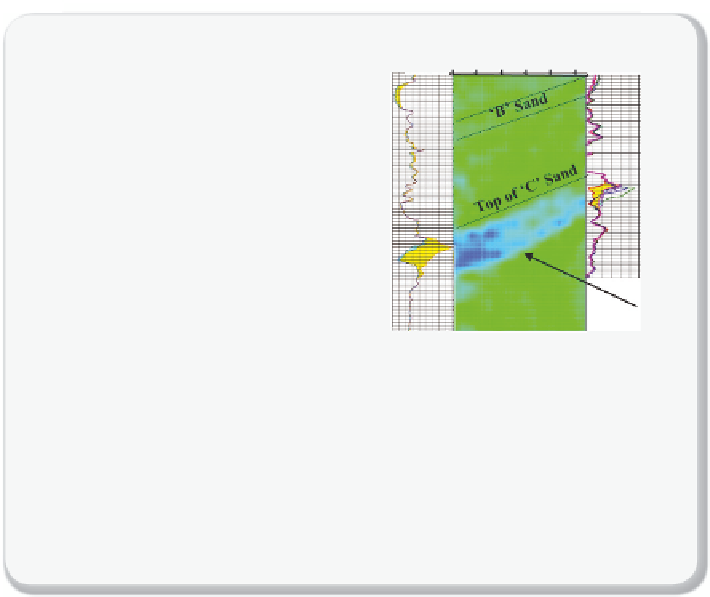
injection site, and (b) changes in seismic velocity as measured from seismic tomog-
raphy, and confi rmatory temporal RST well log data. (a):
Reproduced with permission
from Tom Daley.
(b):
Reproduced from Daley et al.
[10.2]
, with kind permission from
Springer Science + Business Media.
detection of high CO
2
saturation in the so-called C-sand as confi rmed by
logging with the Reservoir Saturation Tool (RST) in the injection and moni-
tor wells.
The geophysical monitoring campaign at the Frio CO
2
injection test
also included the use of a continuous seismic source approach that
could monitor the movement of the plume between wells. This very suc-
cessful demonstration is depicted in
Figure 10.5.6
by the yellow, green,
red, and blue seismic ray paths emanating from a piezoelectric seismic
source placed in the injection well and to hydrophone receivers in the
observation well. In the right-hand frame of
Figure 10.5.6
, the delay
times are shown, which are a measure of the changing seismic velocity
related to how much CO
2
saturation is in the path of the seismic wave as
a function of time for arrivals at the fi ve receivers, each placed at different
depths. As shown, the delay times nicely match the growth of the plume,
with early delays occurring for the blue and red ray paths corresponding
to a short plume at an early time, and subsequent later delays for the


Search WWH ::

Custom Search