Environmental Engineering Reference
In-Depth Information
Commercrial
Residential
Industry
Intl. Transportation
Other Transport
Road Transport
Primary Energy
Non-Energy
35
30
25
13
29
104
20
31
74
22
15
10
224
5
198
0
2010
2020
2030
2040
2050
2060
Year
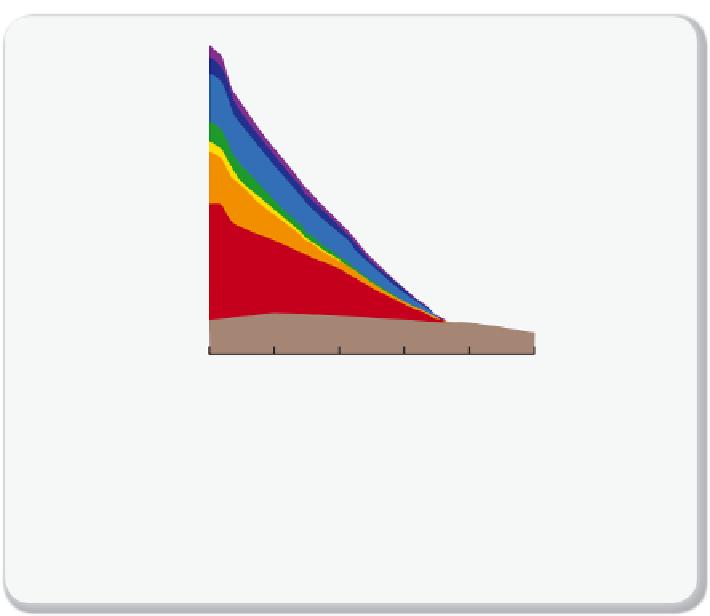
Figure 1.2.9
Future emissions from existing infrastructure by sector
Scenario of expected CO
2
emissions from existing energy and transportation infrastruc-
ture by industry sector. Projections are for a scenario where existing infrastructure is
used to the end of its normal lifetime, and then replaced by non-CO
2
emitting infrastruc-
ture. The dashed lines indicate total emissions from upper- and lower-bounding sce-
narios (282 and 710 Gt CO
2
, respectively). The numbers are cumulative emissions.
Figure adapted from Davis et al.
[1.11].
infrastructure (electricity and transportation). But this ban does not
include the existing infrastructure; we suppose that the current infra-
structure will only be replaced at the end of its normal lifetime by
non-CO
2
-emitting infrastructure. Davis
et al
. [1.11] calculated that under
these assumptions the expected temperature increase of the planet
would be 1.1-1.4
C and the atmosphere would exhibit a concentration
of CO
2
below 430 ppm. This remaining increase in CO
2
levels is due to
the cumulative emission of 496 Gt of CO
2
resulting from the burning of
fossil fuels for the current energy infrastructure that is still in use between
2010 and 2060 (see
Figure 1.2.9
).
Recall that in 2010 annual emission was about 35 Gt of CO
2
. Even if
we were to ban new infrastructure, we would continue to emit carbon at
the annual rate of 35 Gt of CO
2
per year! Our current infrastructure is
committed to emit CO
2
until the end of its natural lifetime. For example,
the average lifetime of a coal-fired power plant is 38.6 years. A coal-fired
power plant that was built in 2007 is committed to emit CO
2
for another
°


Search WWH ::

Custom Search