Environmental Engineering Reference
In-Depth Information
35.3 years. A similar persistence of emitting infrastructure holds for trans-
portation and other industries.
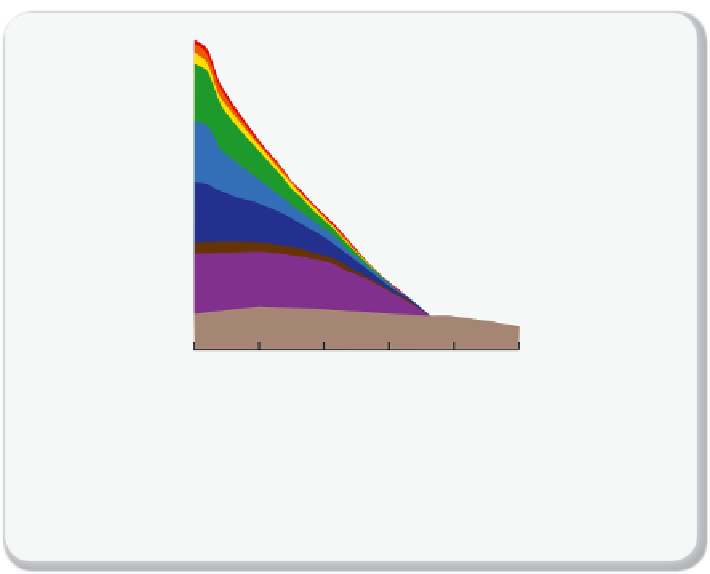
Figure 1.2.10
shows the emissions per country due to committed
infrastructure. If we compare the USA and China we see that both coun-
tries emitted about the same amount in 2010. However, the committed
emissions of China (182 Gt) are more than two times larger than those of
the USA (74 Gt). The reason is that the infrastructure of China is more
recent.
In this context, we can understand why the most threatening CO
2
emissions are from fossil energy-based infrastructure that is being built
now. It will commit the largest amount of future CO
2
emissions, as most
of the new projects are being built with the business as usual
philosophy.
35
Australia
Russia
Japan
EU-27
United States
ROW
India
China
Non-Energy
6
9
30
19
25
74
74
20
15
106
26
10
182
5
198
0
2010
2020
2030
2040
2050
2060
Year
Figure 1.2.10
Future emissions from existing infrastructure by country
Scenario of CO
2
emissions from existing energy and transportation infrastructure by
country. The dashed lines indicate total emissions from upper- and lower-bounding
scenarios (282 and 710 Gt CO
2
, respectively). The numbers are cumulative emissions.
Figure adapted from Davis et al.
[1.11].


Search WWH ::

Custom Search