Environmental Engineering Reference
In-Depth Information
Box 1.2.1
The Wedges Revisited
It has been almost 10 years since Pacala and Socolow published their wedges article
in
Science.
This work has had significant impact because it offered a framework in
which we could address climate change using known technology. According to the
“wedges model,” we should have been ramping up CO
2
reduction and decreasing our
emissions by 0.1 Gt C per year by 2015. However, since 2004 the growth in emissions
has neither stopped nor slowed, but in fact has increased so much that Davis
et al.
[1.5] posed the question as to whether the original idea of 7 wedges would still result
in a maximum increase of less than 2
C in the average global temperature.
Davis
et al.
argue that to achieve the original goal we would need 21 instead
of 7 wedges, and further we would need an additional 10 wedges to completely
phase out CO
2
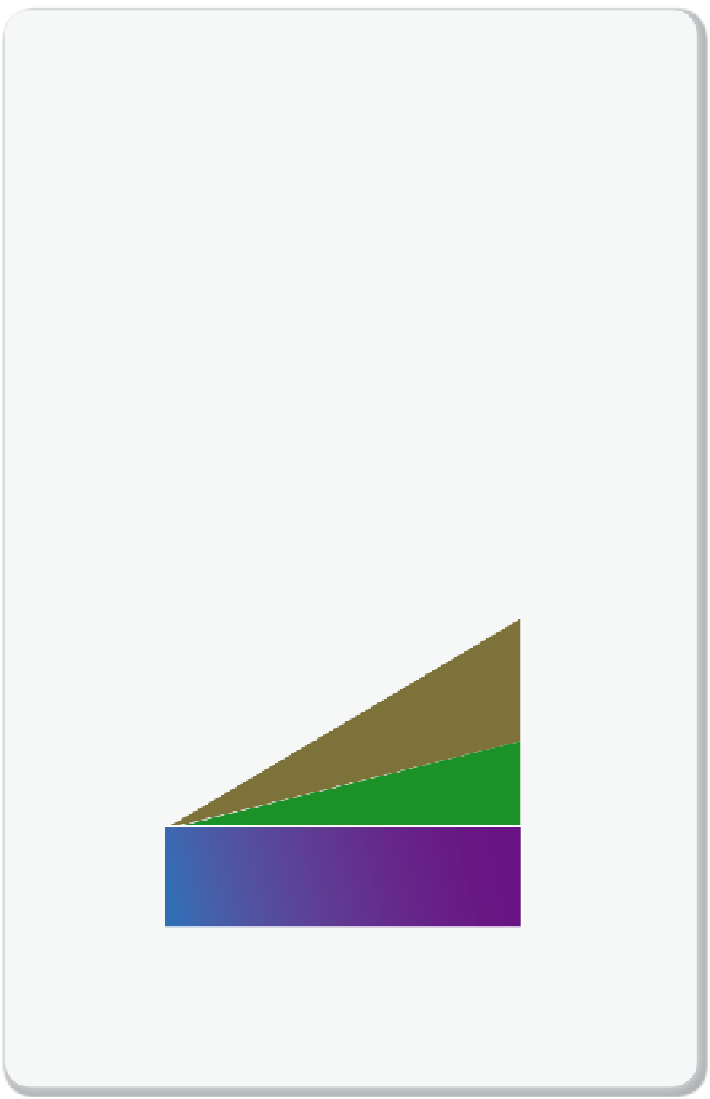
emissions. The figure shows how these wedges are grouped into
different classes:
°
•
12 hidden wedges — in the figure we see a difference between the scenario with
frozen technology and the business as usual scenario equivalent to 12 wedges,
reflecting that innovation continues to decarbonize our energy. Davis
et al.
argue that
making these wedges explicit reduces the danger of double counting innovations.
•
9 stabilization wedges — these are the wedges needed to stabilize the emissions at the
2010 level. They include 2 additional wedges to account for new insights into the
amount of CO
2
that needs to be avoided to ensure that we stay below the 500 ppm level.
•
10 phase-out wedges — to replace the entire energy infrastructure and land-use
practice by methods that do not emit CO
2
.
32
28
12
24
A2
Hidden wedges
20
16
31
9
12
8
10
4
0
2010
2020
2030
2040
2050
2060
Year
Future CO
2
emission scenarios (SRES, see
Box 2.5.1
in Chapter 2). Wedges expand
linearly from 0 to 1 Gt C/year from 2010 to 2060. The total avoided emissions per wedge
is 25 Gt C, such that altogether the hidden, stabilization and phase-out wedges repre-
sent 775 Gt C of cumulative emissions.
Figure modified from
[1.5]
.


Search WWH ::

Custom Search