Environmental Engineering Reference
In-Depth Information
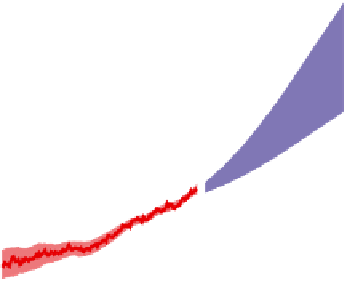
Figure 2.5.9
Sea levels: past and future
Deviation of the mean sea level from the 1980-1990 level. For the period before 1870,
global measurements of sea levels are not available. The shading shows the uncertainty
in the measurements or predictions. The blue shading represents the range of model
projections for the A1B scenario for the 21
st
century.
Figure from IPCC, reproduced with
permission
[2.2].
velocity is 0.1 km/year.
Figure 2.5.11
shows that 28% of the surface of
the earth will experience climate changes that would require species to
migrate faster than an (optimistic) maximum rate of 1 km/year. Hence,
climate change produces unprecedented challenges for the ecosystems
on a very large fraction of the earth.
The problem of Truth
Predictions of climate change rely on the results of very large simula-
tions. On the basis of these predictions, we make far-reaching policy
decisions, investing large sums of money in climate-related projects, and
forcing all of society to make big changes in the way we use and produce
energy. To warrant all the hassle, our predictions had better be right. So
can we trust our models? Or, to phrase the question more dramatically:
Are our climate models telling us the Truth, the whole Truth, and nothing
but the Truth?


Search WWH ::

Custom Search