Environmental Engineering Reference
In-Depth Information
2.6 USE OF FOSSIL FUELS
The night sky of the earth taken by satellite [4] illustrates the tremendous amount of energy con-
sumed by humans. In the United States, 6% of the world's population consumes around 25% of the
world's energy resources and 50% of the mineral resources. It is physically impossible to continue
to consume fossil fuels with exponential growth rates.
2.6.1 O
IL AND
N
ATURAL
G
AS
The magnitude of the problem can be seen by the cost of imported oil in the United States. In 1973,
when consumption was 5.8 Gbbl/year and approximately 40% was imported, the cost was around
$100,000,000,000 ($100 * 10
9
) per year for oil at $40/bbl (if the cost is adjusted for inflation it would
be higher, over $90/bbl in 2008 dollars). Even though consumption of imported oil was reduced in
the 1980s, the cost for imported energy was still quite expensive. In the 1990s oil consumption and
imports in the United States increased again. As of 2007, world oil production/consumption was
around 31 Gbbl/year, and the United States oil consumption was over 7 Gbbl/year, with over half
of that imported at $60 and even higher per barrel. Therefore, the cost for imported oil was over
$200 * 10
9
per year. Notice that crude oil production and oil supply/consumption are different, as
oil supply includes crude oil, natural gas, plant liquids, and other liquids.
The important concept is that crude estimates of resources give fairly good answers as to when
production for finite resources will peak. Also, predictions on the future use of the resource can be
made from past production, as production and consumption of a finite resource will probably be
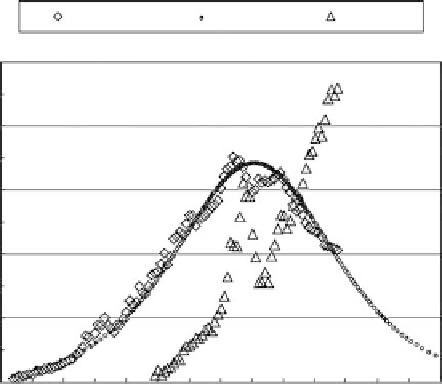
similar to the bell curve. Hubbert began his analysis of the U.S. oil production [5] in the early 1950s
when he was with Shell Research. In 1956, Hubbert predicted that the U.S. oil production would
peak mid-1970s, and he was very close, as the actual peak occurred in 1970. The prediction (logistic
curve) of U.S. oil production in Figure 2.4 used actual oil production through 2006, and the pre-
diction was calculated in a spreadsheet using the method of Deffeyes [6, chap. 7]. Notice that data
include production from Alaskan oil fields and also show that imports are continuing to increase as
the U.S. consumption has increased and production has decreased.
Production
Predicted
Import
5
4
3
2
1
0
1900
1920
1940
1960
1980
2000
2020
2040
FIGURE 2.4
U.S. crude oil production, net imports, and production prediction using logistic curve.
Search WWH ::

Custom Search