Image Processing Reference
In-Depth Information
Light
a
/
p
=
0.2
a
/
p
=
0.5
Light shield
1
0.8
X,
Y
0.6
0.4
a
/
p
=
1
a
: Aperture
0.2
0
No information
p
: Pixel pitch
=
sampling pitch
0
0.5
1
Normalized frequency (
f
/
f
s
)
f
N
: Nyquist frequency
(a)
(Sampling frequency:
f
s
= 1/
p
)
(b)
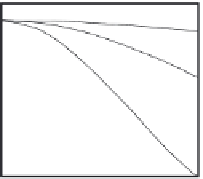
FIGURE 6.4
Space sampling: (a) schematic diagram of space sampling by pixel aperture; (b) frequency dependence of MTF.
frequency. The three states of aperture pitch,
a
/
p
, which are 1, 0.5, and 0.2, normalized by
the sampling pitch
p
are shown. As mentioned in Section 6.1, a wider aperture indicates a
lower amplitude, especially in the higher-frequency region. This signal amplitude shows
the spatial frequency response characteristics in transfer systems and is called the modu-
lation transfer function (MTF). To obtain higher-frequency information, a higher Nyquist
frequency, that is, a shorter pixel pitch, is required, as shown in Figure 6.1. Although a
narrower aperture gives a higher amplitude, amplitude performance is not emphasized
in usual applications because the narrower aperture brings about lower sensitivity, while
higher sensitivity is the first preference for imaging systems.
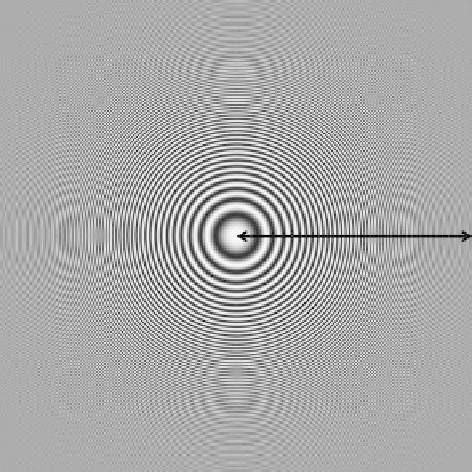
Next, the images that are obtained by spatial sampling are confirmed by simple simula-
tions using spreadsheet software. Using the inputs, the signal is observed using a circular
zone plate (CZP) chart, which is often used to check the frequency of false signals. A cal-
culated drawing in mathematical form is shown in Figure 6.5, indicating in a concentric
FIGURE 6.5
CZP chart (calculated drawing).