Biology Reference
In-Depth Information
should be especially useful for analyzing microtubule dynamics during
morphogenesis.
iii Cell cortex/membranes: Several markers have been particularly useful for
visualizing the cell cortex or membrane. These include a ced-10/Rac::gfp
translational fusion (
Liu et al., 2007
) and various PH-domain constructs
fusedtomCherryorGFP(e.g.,
Audhya et al., 2005
). An example of the
use of ced-10::gfp is shown in
Fig. 5
. The interested reader is encouraged
to consult the primary references for further details. An alternative tech-
nology for visualizing membranes involves the use of lipophilic dyes, such
as the red dye FM4-64, which has been used to visualize cell fusion in the
dorsal epidermis. Since the eggshell is impermeable to such dyes, they
must be introduced via laser perforation of the eggshell as described
above. In the case of FM4-64, its excitation wavelength requires the use
of fairly specialized lasers if multiphoton excitation is used (
Mohler et al.,
1998
).
iv Cytosolic markers: To developmental biologists, fusing the coding region of
EGFP to the regulatory DNA associated with a gene of interest (i.e., GFP
''reporter constructs'') is often used to assess the tissue-specific and temporal
patterns of transcriptional activation of a gene. Such information provides
valuable information about how the expression of a gene is regulated.
However, such transcriptional reporters can also be invaluable for live
embryo imaging for several reasons. First, such reporter constructs result
in the expression of GPF in the cytosol; because GFP is fairly small, these
reporters are capable of percolating into small volumes within the cytoplasm,
including fine protrusions extended by cells as they migrate. Second, the
highly specific pattern of expression of some genes allows either many or a
very small number of cells to be visualized against a dark background,
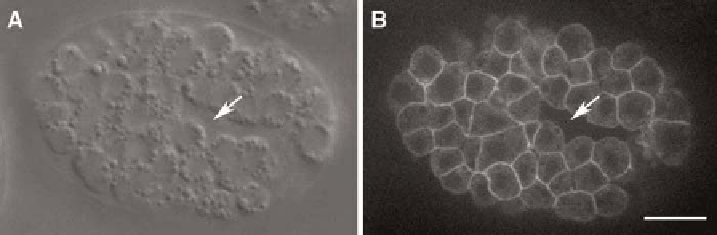
Fig. 5
CED-10/Rac::GFP allows imaging of cell cortices during morphogenesis. The same embryo
expressing ced-10::gfp (
Liu et al., 2007
) was imaged using fluorescence and Nomarski microscopy. The
arrows indicate the closing ventral gastrulation cleft. Images were acquired using a Perkin-Elmer
UltraView LCI system, with Hamamatsu Orca II-ER camera. Images courtesy of R. Zaidel-Bar.
Bar = 5
m
m.
Search WWH ::

Custom Search