Environmental Engineering Reference
In-Depth Information
11.0
10.5
10.0
9.5
9.0
8.5
0
2000
4000
6000
8000
10000
Distance (m)
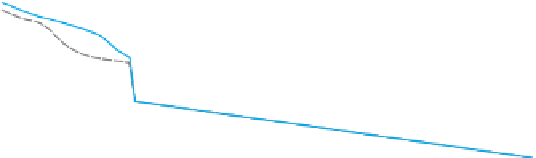
Figure 7.17. Changes in the bed
level in the canal with a weir at
2 500 m from the intake after 30,
60 and 90 days according to
Brownlie's predictor.
Initial bed
Bed C at 30 days
Bed C at 60 days
Bed C at 90 days
and actual concentrations upstream of the weir than for the gate, both after
90 days. The concentration even decreases in relation to the values after
30 and 60 days.
An explanation for the location of the gate and the weir at 2 500 m
from the headworks in this example is the fact that when these structures
are placed at the end of the 10 000 m long canal that the sediment for
both structures has only progressed up to 4 000 m after 90 days and no
difference in sedimentation behaviour between a weir or a gate could be
observed.
7.7 CASE 5 MAINTENANCE ACTIVITIES
The roughness of the bottom and side slopes will have a specific impact
on the sedimentation in an irrigation canal. SETRIC will calculate the
roughness on the canal bed and sides slopes separately; the roughness on
the bed is determined with the van Rijn (1984C) method, which includes
the flow conditions and the bed form and grain-related parameters. The
next step is the equivalent roughness coefficient (
k
s
) that takes into
account the sidewall effect (Mendez, 1998 and Paudel, 2010); the model
computes the total friction factor from the composite roughness of the
cross section. The roughness conditions will vary over time, especially
sedimentation will induce the development of bed forms and the total
equivalent friction factor is computed for every time step and for each
flow condition in each cross section.


Search WWH ::

Custom Search