Environmental Engineering Reference
In-Depth Information
11.0
10.5
10.0
9.5
9.0
8.5
0
2000
4000
6000
8000
10000
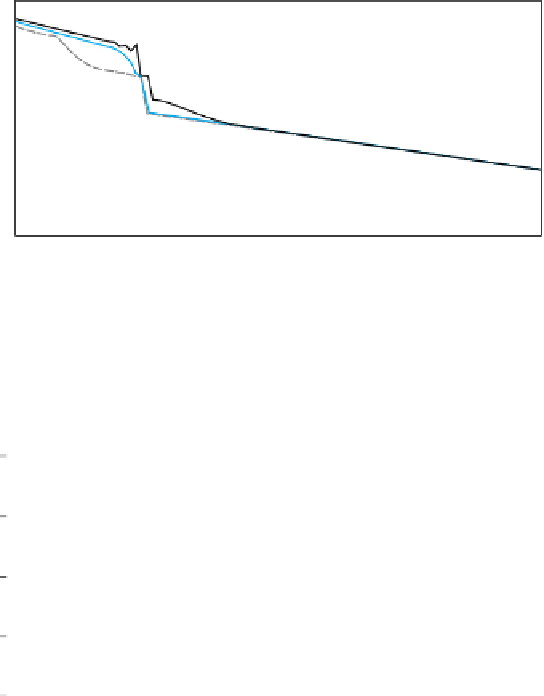
Distance (m)
Figure 7.15. Changes in the bed
level in the canal with a gate at
2 500 m from the intake after 30,
60 and 90 days according to
Brownlie's predictor.
Initial bed
Bed C at 30 days
Bed C at 60 days
Bed C at 90 days
160
140
120
100
80
60
40
20
0
1000
2000
3000
4000
5000
6000
7000
8000
9000
10000
0
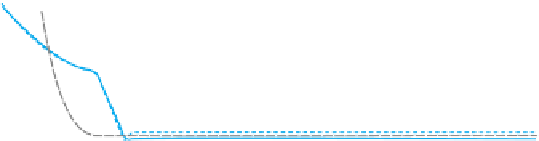
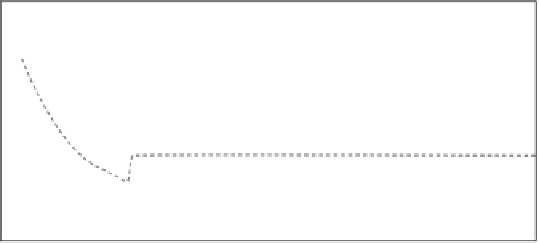
Figure 7.16. Changes in the
concentration in the canal with
a weir 2 500 m from the intake
after 30, 60 and 90 days
according to Brownlie's
predictor.
Distance (m)
C-eq at 0 days
C-act at 0 days
C-act at 30 days
C-eq at 30 days
C-act at 60 days
C-eq at 60 days
C-eq at 90 days
C-act at 90 days
This phenomenon is the most striking difference in behaviour between the
gate and the weir. The gate will not trap any sediment inside the structure;
the weir will trap the sediment in the upstream canal section until a new
bottom slope has been developed for which the equilibrium concentration
is in line with the incoming sediment concentration. Figure 7.16 clearly
shows that the change in concentration after 90 days differs from Case 4.1
(Figure 7.14). The sedimentation upstream of the weir will continue until
the bottom level is steep enough to transport the incoming sediment to the
downstream canal section. Figure 7.16 also shows smaller equilibriums


Search WWH ::

Custom Search