Environmental Engineering Reference
In-Depth Information
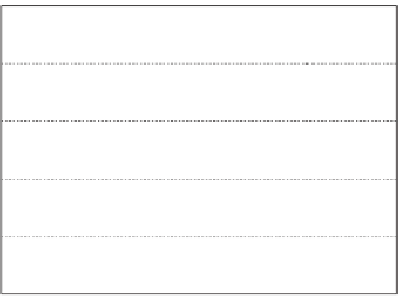
0.01
ψ
1
= 0
ψ
2
= -25 mV
S
w
= 0.8
0.008
0.006
Interface location (
ψ
1
= 0)
0.004
0.002
0
0.00
0.05
0.10
0.15
0.20
0.25
0.30
0.35
0.40
Velocity profile (mm/sec)
Figure 5.11
Velocity profile across the capillary (zero oil-water interface potential)
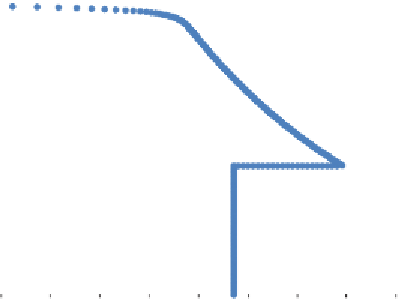
0.01
ψ
1
= -15 mV
ψ
2
= -25 mV
S
w
= 0.8
0.008
0.006
Interface location (
ψ
1
= -15 mV)
0.004
0.002
0
0.00
0.05
0.10
0.15
0.20
0.25
0.30
0.35
0.40
Velocity profile (mm/sec)
Figure 5.12
Velocity profile across the capillary (with -15 mV oil-water interface
potential)
Figure 5.13 shows the analytically evaluated
k
er,ow
coefficient as a func-
tion of water saturation. As also observed in the case of experimentally
evaluated
k
er,ow
coefficient (see figure 5.6), the coefficient increases with
increasing in water saturation initially, to slightly over 0.1 at 50% water
saturation. The coefficient decreases beyond the 50% saturation, because
of less oil available in the capillary to be produced.


Search WWH ::

Custom Search