Civil Engineering Reference
In-Depth Information
the elastic part up to the proportional limit stress with Young's modulus of
(
E
) 200 GPa and Poisson's ratio of 0.3 that were used in the finite element
model. Similar to the composite plate girder G1, the steel plate girder-
concrete slab interface was modeled by interface elements available within
the ABAQUS [1.29] element library.
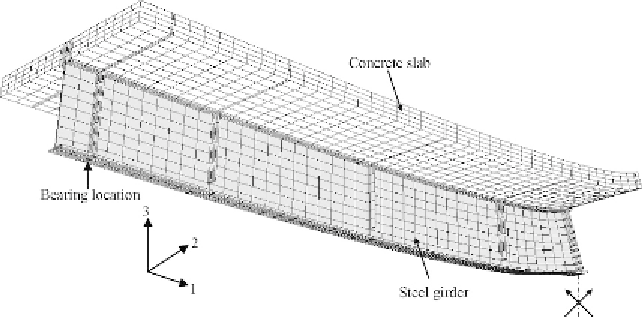
The developed finite element model for the composite plate girder G2
The failure loads, failure modes, and load-midspan deflection curves obtained
experimentally and numerically using the finite element model were com-
pared. The deformed shapes of composite plate girder G2 at failure observed
numerically are shown in
Figure 7.10
, which is in good agreement with the
experimentally and confirmed numerically was combined steel yielding (SY)
in the bottom flange of the steel plate girder and concrete crushing (CC). The
data obtained fromABAQUS [1.29] have shown that the von Mises stresses at
the maximum stressed fibers at the bottom flanges at midspan exceeded
the measured yield stress as well as the stresses in the concrete slab at
midspan reached the concrete compressive strength. In
Figure 7.11
, the stress
(principal stresses in direction 2-2) contours at failure of the composite plate
girder G2 are plotted. It can be seen that the yield stresses were reached at
midspan in the concrete (compressive stresses with negative sign) and lower
steel plate girder flanges (tensile stresses with positive sign). In addition, in
Figure 7.12
, the plastic strain (principal strains in direction 2-2) contours at
failure of the composite plate girder G2 are plotted. It can be seen that the
Figure 7.10 Deformed shape at failure of composite girder G2 (enlarged 10 times).
Search WWH ::

Custom Search