Civil Engineering Reference
In-Depth Information
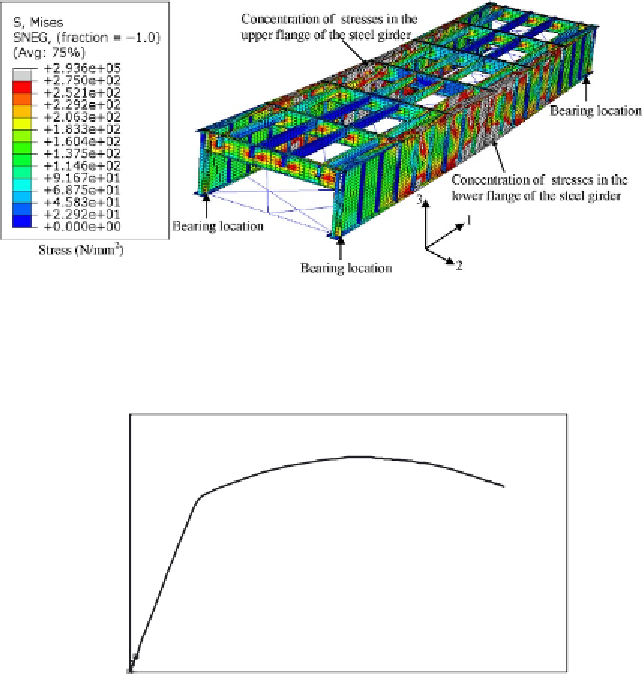
Figure 6.35 Stress (von Mises) contours of the double-track open-timber floor plate
girder railway steel bridge at failure.
8000
7000
6000
5000
4000
3000
2000
Design load (EC3)
FE
1000
0
0
100
200
300
400
500
600
Mid-span deflection (mm)
Figure 6.36 Load per one main girder-midspan deflection relationships for the double-
track open-timber floor plate girder railway steel bridge at ultimate limit state.
the yield stresses were reached at midspan in the upper (compressive stresses
with negative sign) and lower flanges (tensile stresses with positive sign) of
the main plate girder. In addition, in
Figure 6.35
, the von Mises yield stress
contours at failure are plotted. It can be seen that the yield stresses were
reached at midspan in the upper and lower flanges of the main plate girder.
The load-midspan deflection curve predicted numerically was plotted in
Figure 6.36
.
It can be shown that the relationship is nonlinear, which con-
firms that the deformations exceeded the elastic range. The ultimate load


Search WWH ::

Custom Search