Civil Engineering Reference
In-Depth Information
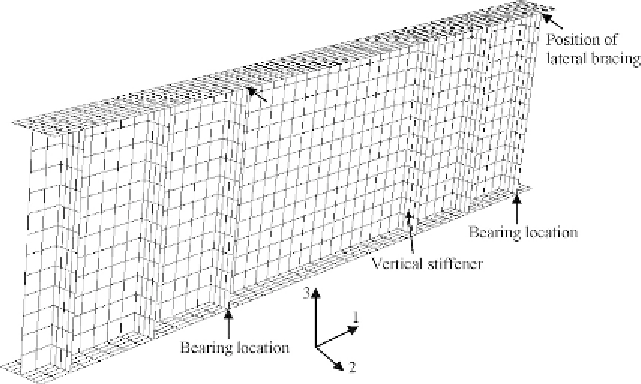
Figure 6.10 Finite element mesh of the small-scale built-up I-section plate girder T2.
The hinged support of T2, shown in
Figure 6.9
,
was prevented from dis-
placement in the horizontal direction (direction 1-1 in
Figure 6.10
)
and the
vertical direction (direction 3-3 in
Figure 6.10
). On the other hand, the
roller support of T2, shown in
Figure 6.9
,
was prevented from displacement
in the vertical direction only (direction 3-3 in
Figure 6.10
)
. To account for
the lateral restraints of the compression flange, the top compression flange
was prevented from lateral displacements, in direction 2-2 of
Figure 6.10
,
at the end supports, which is identical to the test T2. The load was applied
in increments as concentrated static load, which is also identical to the exper-
imental investigation. The nonlinear geometry was included to deal with the
large displacement analysis.
The stress-strain curve for the structural steel given in the EC3 [2.11] was
adopted in this study with measured values of the yield stress (
f
ys
) and ulti-
ABAQUS [1.29] (using the PLASTIC option) allows a nonlinear stress-
strain curve to be used (see Section 5.4.2 of
Chapter 5
). The first part of
the nonlinear curve represents the elastic part up to the proportional limit
stress with Young's modulus of (
E
) 200 GPa and Poisson's ratio of 0.3 used
in the finite element model. Since the buckling analysis involves large inelas-
tic strains, the nominal (engineering) static stress-strain curves were con-
verted to true stress and logarithmic plastic true strain curves as detailed
in Section 5.4.2.
Search WWH ::

Custom Search