Civil Engineering Reference
In-Depth Information
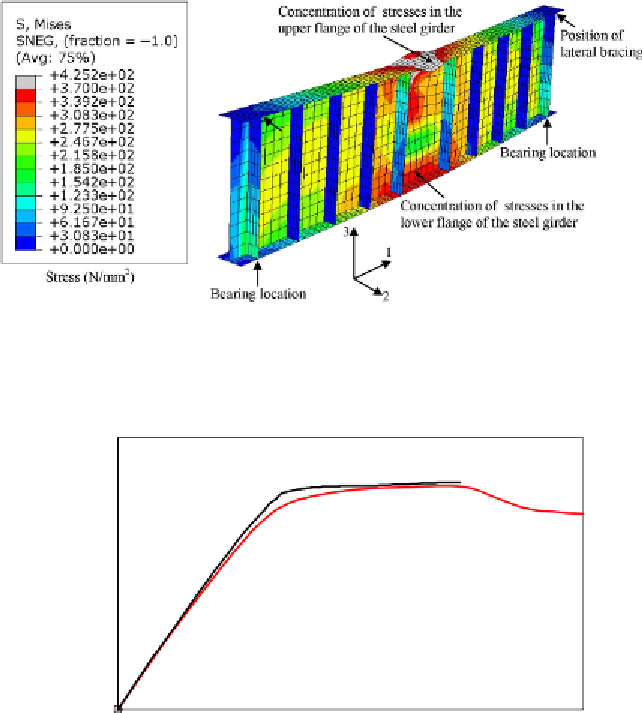
be seen that the plastic strains were concentrated at midspan in the upper
(compressive strains with negative sign) and lower flange (tensile strains with
positive sign). Furthermore, in
Figure 6.7
, the von Mises yield stress con-
tours at failure of the small-scale built-up I-section plate girder T1 are plot-
ted. It can be seen that the yield stresses were reached at midspan in the upper
and lower flanges. The load-midspan deflection curves predicted experi-
mentally and numerically were also compared as shown in
Figure 6.8
. It can
Figure 6.7 Stress (von Mises) contours at failure of the small-scale built-up I-section
plate girder T1 (enlarged 5).
1800
1500
1200
900
600
Test
FE
300
0
0
4
8
12
16
20
Deflection (mm)
Figure 6.8 Comparison of load-midspan deflection relationships obtained experimentally
and numerically for the small-scale plate girder T1.


Search WWH ::

Custom Search