Environmental Engineering Reference
In-Depth Information
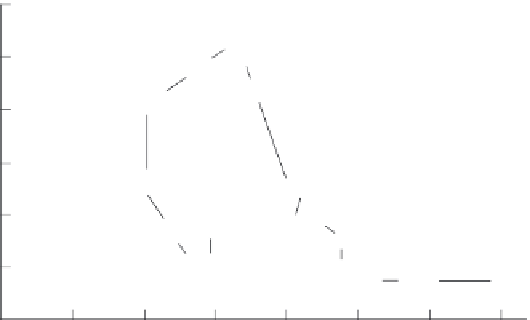
Fig. 7.16
The fl eet size
of the North Pacifi c fur
seal fi shery (predators)
responded to the size of
the seal herd (prey)
between 1882 and 1900
by exhibiting an
anticlockwise predator-
prey spiral. (After
Hilborn & Walters,
1992, from data of
Wilen, 1976, unpub-
lished observations.)
120
1894
1892
1893
100
1895
1891
1896
80
60
1889
1897
1890
1887
1888
40
1900
1898
1886
1899
20
1885
1884
1883
1882
0
0
200
400
600
800
1000
1200
1400
Herd size index
In the strict sense, a harvester who inadvertently fails to follow rules and regula-
tions and illegally kills an animal is a poacher. But the term is usually reserved for
the more overtly antisocial behavior of criminals who operate outside the manage-
ment regime. The Saiga antelope (Section 7.2.2) provides an example of how poach-
ing can be taken into account. Poachers are thought to take 16% of the legal antelope
harvest each year, three quarters of which are males with their valuable horns. This
sex bias actually makes rather little difference to the size of the Saiga population,
because females give birth to almost as many babies despite the loss of a proportion
of males. However, the legally taken yield, expressed in Russian roubles, is signifi -
cantly reduced in the poached population compared to one with no poaching
(Figure 7.17) because of the smaller number of valuable males left for the lawful
hunters. Whenever poaching is a problem, and it almost invariably is, two steps need
to be taken: (i) improve policing and compliance with the rules; (ii) set the total
allowable catch at a level that takes poaching into account so that the stock is not
overexploited.
Another problem related to human behavior has recently come to light. The
harvest of bushmeat in tropical forests (involving about 400 species of mammals)
poses a signifi cant threat to the biodiversity of these species-rich forests. But
Fig. 7.17
The effects of
poaching on the legal
yield (millions of
Russian roubles) of
Saiga antelopes in
relation to hunting
effort (expressed as
proportion killed) in a
constant effort regime.
The graph for the
population where
poaching occurs
(squares and solid line)
shows a substantial
reduction in legal yield
compared to the graph
for the unpoached
population (circles and
dashed line). (After
Milner-Gulland, 1994.)
2.0
1.6
1.2
0.8
0.4
0
2
4
6
8 10 12 4 618
Hunting mortality (%)


Search WWH ::

Custom Search