Environmental Engineering Reference
In-Depth Information
(Box 6.1). Equally, it makes no sense at all to strive to obtain the last few tonnes of
an MSY if the money spent in doing so could be more effectively invested in another
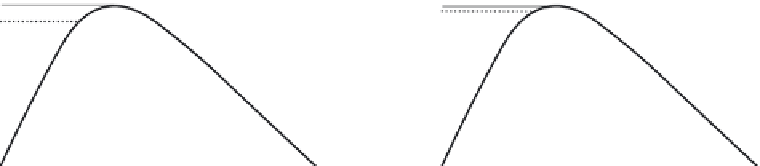
means of food production. The basic idea is illustrated in Figure 7.14a. Looked at
from an economic point of view the aim should be to maximize not total yield but
net value - the difference between the gross value of the harvest and the costs of
obtaining it. The costs have two components: fi xed costs (interest payments on ships
or factories, insurance, etc.) and variable costs that increase with harvesting effort
(fuel, crew's expenses, fi sh processing, etc.). The fi rst thing to note is that the eco-
nomically optimum yield (EOY) is less than the MSY, and for this reason alone the
chance of overfi shing is reduced. Note, however, that the difference between the
EOY and the MSY is least when most costs are fi xed (so that the 'total-cost' line has
a shallower slope; Figure 7.14b). And this is most likely to be the case in high-invest-
ment, highly technological operations such as deep-sea fi sheries. As a result, these
are more prone to overfi shing even with management aimed at optimizing economic
returns.
Spiny lobsters (
Panulirus argus
) provide the most valuable fi shery in Cuba. Fixed
costs in the fi shery are US$24,840 per boat, and variable costs consist of US$171 per
boat per day together with processing costs of US$687 per tonne of raw lobster. Most
lobsters are sold whole (value about US$12 per kg) but 30% as frozen tails (US$27.87
per kg). Some lobsters are more valuable than others, as was the case with male as
opposed to female Saiga antelope (Figure 7.7). Putting together all the economic
information for the lobster fi shery in a particular year (2002), revenues were US$55.87
million, fi xed costs were US$2.91 million, variable costs US$6.56 million, leaving a
profi t of US$46.41 million.
Previously the fi shery has been managed simply according to biomass yield and
not in terms of economic profi t. In their model, based on extensive economic and
biological data, Puga et al. (2005) determined that the long-term maximum profi t
(US$1.7306 per lobster recruited into the fi shery) would be obtained with a fi shing
effort of 24,016 boat fi shing days, slightly lower than needed to obtain the MSY
(26,405 days; US$1.7260 per recruit), but higher than what is currently the case
(18,315 days in 2000-2; US$1.6950 per recruit). On the other hand, the larger effort
(a)
(b)
Total
cost
MSY
EOY
MSY
EOY
Total
cost
Net yield
Net yield
Variable costs
Variable costs
Fixed costs
Fixed costs
Effort
Effort
Fig. 7.14
(a) In this diagram, gross yield in dollars is represented by the familiar hump-shaped curve. The economic
optimum yield (EOY), that which maximizes profi t to the fi shing industry, occurs at the point on the effort curve where the
difference between gross yield and total costs (fi xed plus variable) is greatest. At this point, the gross yield and total cost
lines have the same slope. The EOY is obtained at a smaller effort than needed to obtain the MSY (top of the curve). (b) The
effort required to obtain the EOY lies closer to the MSY when fi xed costs make up a larger proportion of total costs.


Search WWH ::

Custom Search