Environmental Engineering Reference
In-Depth Information
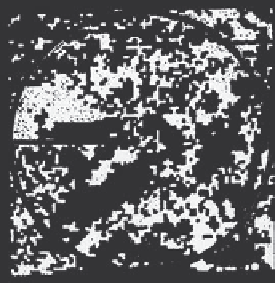
Fig. 4.10
The spatial
arrangement of patches
(dark) of breeding
habitat (left hand
panels) and breeding
plus dispersal habitat
(right hand panels) in a
typical landscape patch
containing fl ying
squirrels (top panels)
and a random forest
location (bottom
panels). The fl ying
squirrel patch contains
4% breeding habitat
and 52.4% breeding
plus dispersal habitat,
compared with 1.5%
and 41.5% for the
random landscape.
Dispersal habitat in the
squirrel landscape is
much more highly
connected than in the
random landscape.
(After Reunanen et al.,
2000.)
1000 m
1000 m
Pteromys
1000 m
1000 m
Random
and silvertop stringybark (
Eucalyptus laevopinea
). By recording bat s using ultrasonic
detectors, the researchers were able to document the number of passes made by a
variety of species that could be separately identifi ed from their calls. They compared
bat activity both in logged and unlogged forest patches, and in different locations
in each case - along forest tracks, off track in mid-forest and along unlogged 'ripar-
ian' margins beside forest streams.
Surprisingly there was no statistically signifi cant difference in bat activity between
unlogged and logged locations. What really mattered was the presence of forest
tracks as dispersal pathways for feeding activity. In both logged and unlogged situ-
ations, much higher activity was recorded on forest tracks (183 and 196 bat move-
ments per night in logged and unlogged forest respectively) than off track (5 and
36 movements per night). The stream riparian areas, which like forest tracks provide
linear pathways for the bats, showed intermediate activity (55 and 26 movements
per night). Bat species richness was actually highest on forest tracks in the logged
areas.
The least maneuverable bats would be predicted to do well in the uncluttered
fl ight paths provided by tracks. This was indeed the case (Figure 4.11a-d), but in
addition the highly maneuverable
Rhinolophus megaphyllus
made use of the pathways
(Figure 4.11e), perhaps because insect prey density was higher there, or because of
enhanced hunting success or simply as a 'commuter' route.
An index of clutter was calculated for every recording site to integrate percentage
vegetation cover in each of four strata - groundcover, shrub, understorey trees
(including
Eucalyptus
regrowth in the logged sites) and large eucalypts emerging
into the upper canopy. Overall bat activity declined signifi cantly with the increasing


Search WWH ::

Custom Search