Environmental Engineering Reference
In-Depth Information
30
20
10
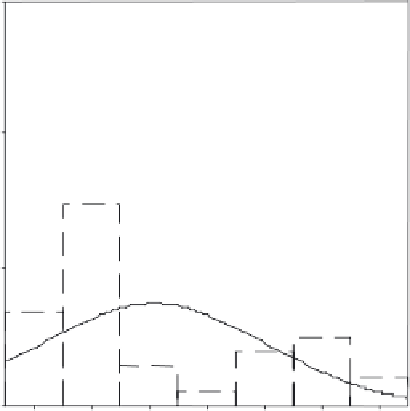
Std. Dev = 1.95
Mean = 2.1
N = 37.00
0
0.0
1.0
2.0
3.0
4.0
5.0
6.0
Figure 16.4 Distribution pattern of species occurrence in sample plots in Guinea
Table 16.3 Sorenson's species similarity per sample plot in Ghana
Plot
1
2
3
4
5
6
7
8
9
Comparative species richness among 10 sample plots inventoried in Ghana
(underlined values in the diagonal indicate total richness of species in
individual sample plots)
1
50
25
18
21
21
9
18
28
25
2
43
22
23
18
10
20
22
16
3
41
22
15
11
16
19
18
4
36
18
10
18
21
21
5
28
9
17
19
15
6
14
11
10
9
7
26
21
16
8
37
17
9
43
Percentage similarity of species among the 10 sample plots inventoried in Ghana
1
_
54
40
49
54
28
47
64
54
2
_
52
58
51
35
58
55
70
3
_
57
44
40
48
49
43
4
_
56
40
58
58
53
5
_
43
63
59
42
6
_
55
39
32
7
_
67
46
8
_
43
9
_
Mean
standard error
50
2%