Image Processing Reference
In-Depth Information
Toner master curves
Gloss (
g
)
TMA
C
+
R
(λ)
M
Color
model
Fuser temperature
Y
Reflectance
K
Fuser model
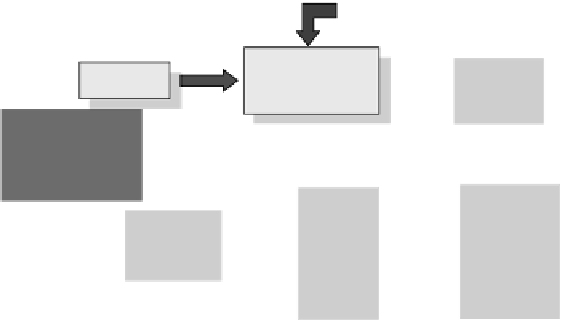
FIGURE 10.50
Effect of transferred image on the paper.
Halftoning strategy:
(Bayer, error diffusion)
Profile
selection
Input image
(
Lab
,
sRGB
)
Halftone
patch
CMYK
2-D spatial
quantizer
Q
(
x
) [0,1]
Generate
ROS profile
MTF
Laser beam
profile
(Gaussian, sinc
2
)
Intensity
profile
.icc profile
X
Toner
curves
Master
C
M
Exposure
Fuser
+
Color
model
R
(λ)
V
g
V
bias
V
a
Color space
computation
Output
image
(
Lab
,
sRGB
)
Development
Y
K
Reflectance
Transfer
Printer
actuators
: Control inputs
: Signal flow
Toner mass
transfer
(mg/cm
2
)
Fuser
temperature
Printer parameters
: Parameters
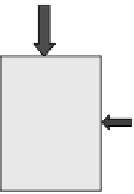
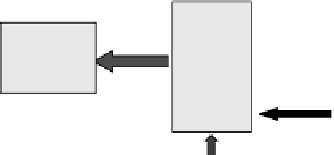
FIGURE 10.51
Image flow in the virtual printer model.
simulation, we assume that the input image is given in the L*a*b*orsRGB format.
This input image needs to be transformed to a CMYK separated image before it can
be processed by the model. For this purpose, it is necessary to develop a machine
pro
le that is an inverse mapping between L*a*b* (or XYZ) and device CMYK
values using techniques described in Chapter 7.
Figure 10.51 shows an overview of the image
flow in the printer model. The
input to the model is an electronic image in sRGB format and the output of the
model is an electronic image in the CIELab format, which can be transformed to
the sRGB format to display on the screen for evaluation purposes. The different
stages that the input image goes through are summarized as follows. We omit the
computational details like scaling of images and the resolution concerns for a later
section.


Search WWH ::

Custom Search