Image Processing Reference
In-Depth Information
18
35
Mean
95%
Mean
95%
16
30
14
25
12
20
10
15
8
10
6
4
5
1
2
3
4
5
6
7
8
9
10
1
2
3
4
5
6
7
8
9
10
Number of clusters
Number of clusters
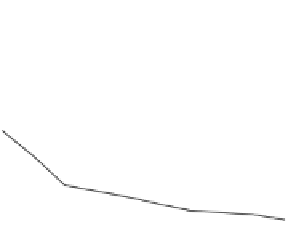
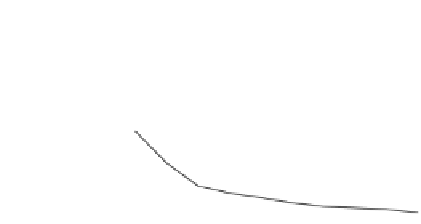
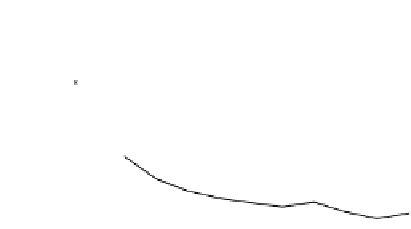
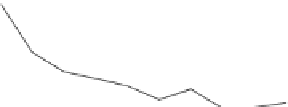
FIGURE 7.9
Error between experimental data and a piecewise linear affine model as a
function of the number of clusters for test colors.
7
11
Mean
95%
Mean
95%
6.5
10
6
9
5.5
8
5
4.5
7
4
6
3.5
5
3
4
2.5
2
3
1
2
3
4
5
6
7
8
9
10
1
2
3
4
5
6
7
8
9
10
Number of clusters
Number of clusters
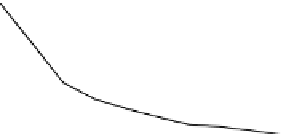
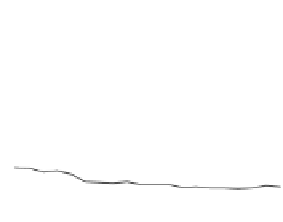
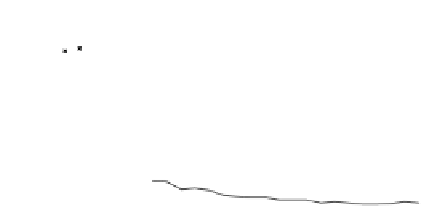
FIGURE 7.10
Error between experimental data and a piecewise linear quadratic and cubic
model as a function of the number of clusters (computed for up to 10 clusters) for test colors
for printer A with 10
4
characterization data.
5.5
8.5
Mean
95%
Mean
95%
8
5
7.5
4.5
7
6.5
4
6
3.5
5.5
5
3
4.5
2.5
4
2
3.5
0
2
4
6
8
10
12
14
16
18
20
0
2
4
6
8
10
12
14
16
18
20
Number of clusters
Number of clusters
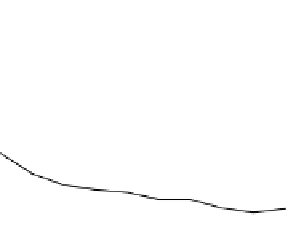
FIGURE 7.11
Error between experimental data and a piecewise linear quadratic and cubic
model as a function of the number of clusters (computed for up to 20 clusters) for test colors
for printer B with 16
4
characterization data.












Search WWH ::

Custom Search