Image Processing Reference
In-Depth Information
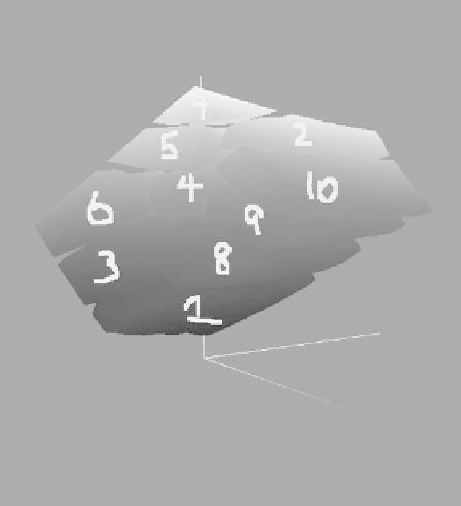
FIGURE 7.8
Ten cluster L*a*b* gamut (clustering was done in L*a*b* space).
clusters A
1
, A
2
,...,A
K
. Figure 7.8 illustrates pictorially the clustered color gamuts in
L*a*b* space. Clusters obtained in CMYK space is not shown.
Example 7.2
Using RLS algorithm and training samples from Example 7.1, (a) obtain a piece-
wise linear af
ne model and (b) piecewise linear quadratic and cubic model for
different clusters. Show the model accuracy as a function of the number of
clusters. Describe the key steps in assigning clusters and the parameter adaptation
process for the piecewise linear model.
S
OLUTION
The accuracy error with respect to the number of clusters of the piecewise linear
af
ne model with 13 parameters in each cluster is shown graphically in Figures 7.9
through 7.11. These data were purposely produced for an uncalibrated printer.
When the simulation reached 10 clusters, cluster #6 had a minimum of 550 colors
and cluster #8 had a maximum of 2577 colors. As the number of training colors
assigned to a particular cluster reduces, the parameter estimation becomes less
accurate. The number of modeling parameters (i.e., number of elements in the
u
matrix, Equation 7.2) is another factor that requires optimization, since a higher
number of parameters may model the noise by over
tting the data. As might be
expected, the curves in Figure 7.9 show that the accuracy error (both mean and
95%) almost decreases monotonically with an increase in the number of clusters.
Thus the trend is clearly in the right direction. In general, if there are more training
Search WWH ::

Custom Search