Information Technology Reference
In-Depth Information
F
IG
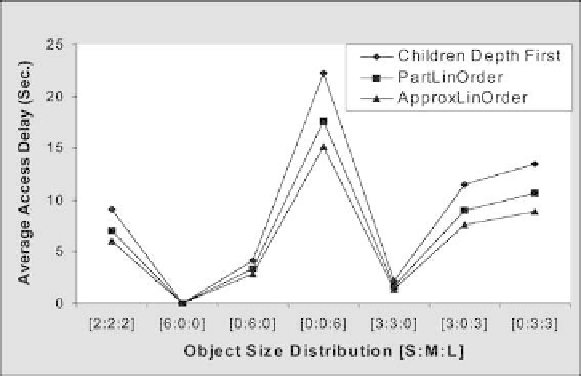
. 15. Average access delay vs. objects size distribution.
tiallyLinearOrder algorithm since, the latter attempts to cluster strongly connected
objects closer to one another than loosely connected ones and, hence, compromises
the linearity property for the loosely connected objects.
4.3.2.2 Size Distribution.
Figure 15
shows the effects of varying the dis-
tribution of the object size among small, medium, and large. As expected, the small-
est average access delay took place when the air channel contained smaller objects
(point [6
:
0
:
0]). However, as the population of objects shifted towards the larger
objects, the average access delay increased (point [0
:
0
:
6]).
4.3.2.3 Next Node Ratio.
During the course of a query, objects are either
accessed along the semantic links or in a random fashion—a C
:
R ratio of 10
:
1
means that for all accesses between two objects, 10 are based on the semantic links
and 1 on a random basis.
Figure 16
depicts the effect of varying the ratio of the
next-node access type. At one extreme (C
:
R
=
10
:
0), when all objects were
accessed along the semantic links, the average access delay was minimum. The delay,
however, increased for randomly accessed objects. Finally, where all the accesses are
on a random basis, clustering (and linearity) does not improve the performance, and
all mapping algorithms perform equally.
4.3.2.4 Out Degree Distribution.
This parameter indicates the number
of children of a node within the graph—an out-degree of 0 indicates a sink node.