Environmental Engineering Reference
In-Depth Information
of time required to implement the appropriate
countermeasures for the assessed I&C system.
For example, during the assessment of security,
the prioritization of vulnerabilities identified on
the basis of process-product approach, should
be performed according to their criticality and
severity, representing their corresponding stages
in the cyber security assurance of the given I&C
system. The main goal of this step is to identify
the most critical security problems within the
given set. Prioritization may require the creation
of a criticality matrix, where each vulnerability
is represented within single rows. In such cases,
it is possible to manage the security risks of the
whole I&C system via changing the positions of
the appropriate rows within the matrix (the small-
est row number in the matrix corresponds to the
smallest risk of occurrence).
During the performance of GA, the identifi-
cation of discrepancies (and the corresponding
vulnerabilities in case of security assessment), can
be implemented via separate detection/analysis of
problems caused by human factors, techniques
and tools, taking into account the influence of
the development environment.
Then, after all identified vulnerabilities are
prioritized, it is possible to assure security of
the I&C system by implementing of appropriate
countermeasures. Such countermeasures should
be selected on the basis of their effectiveness
(also, in context of assured coverage), technical
feasibility, and cost-effectiveness. But there is
an inevitable trade-off between a set of identi-
fied vulnerabilities and a minimal number of
appropriate countermeasures, which allows us to
eliminate vulnerabilities or to make them difficult
to be exploited by an adversary. The problem of
choosing such appropriate countermeasures is
an optimization problem and is still challenging.
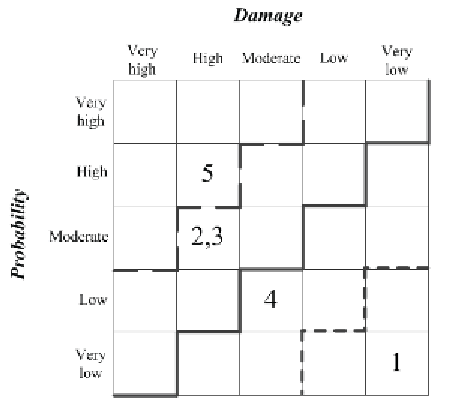
Security criticality matrix is depicted in Fig-
ure 12. Each of the numbers inside the matrix
represents an appropriate row number of IMECA
table. Figure 12 also represents several cases of
criticality diagonal for the matrix; depending on
the case, possible acceptable values of risks are
below the certain diagonal.
Figure 12. Criticality matrix and several possible criticality diagonals
Search WWH ::

Custom Search