Information Technology Reference
In-Depth Information
8000
H(
α
),V(
α
)
R
CE
1.4
7000
0.9
α
α
0.4
6000
−1.6
−1.2
−0.8
−0.4
0
−1.6
−1.2
−0.8
−0.4
0
(a)
(b)
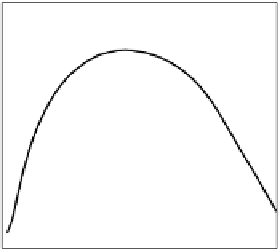
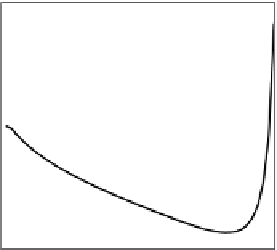
Fig. 2.12 (a) The
H
S
(solid line),
V
(dashed line) curves for
a
=0
.
95
,b
=
−
1
.
7
,
and
c
=0
.
9
.(b)The
R
CE
curve for
a
=0
.
95
,b
=
−
2
.
4
,and
c
=0
.
9
.Thecurves
were obtained by numerical simulation with 4000 instances per class.