Information Technology Reference
In-Depth Information
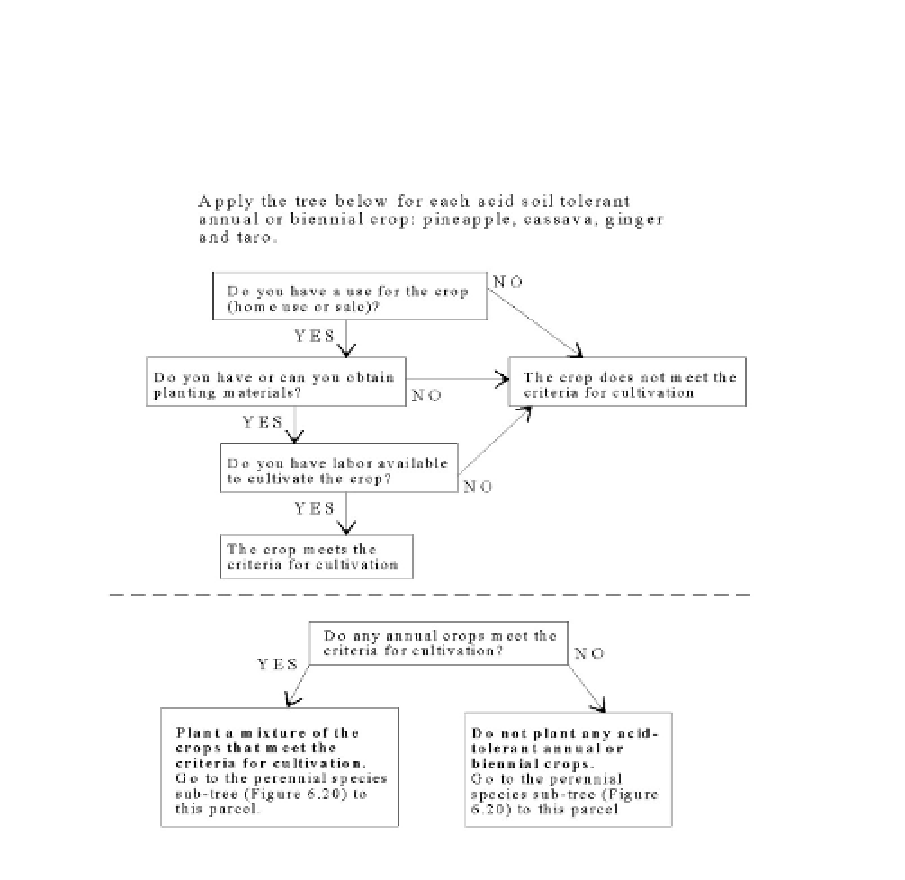
Appendix Figure 6 (Robotham, 1998, Figure 6.19).
8. Appendix 2
Example table illustrating the calculation of cumulative probability. Initial probability of P
deficiency was considered 0.5, which on a scale of 0 to 1 indicates no information for or
against P being deficient in the examined soil. The corresponding odds of a deficiency then
is 50/50 or equal to 1. As various factors are considered, each with a probability of P
deficiency (P(def)), the evidence accumulates until a final cumulative probability of 0.83,
which indicates a high probability of P being deficient in the measured soil soil (Yost et al
1999; Pearl 1988).
Search WWH ::

Custom Search