Information Technology Reference
In-Depth Information
with more redundancies as expected. For PRT, a total of 10 curves are plotted, each with a
different setting of
K
min
, ranging from 1 to 10, representing the number of redundancies that
are actively transmitted. There are two observations. First, the systemMTTF of PRT for small
values of
K
max
is similar to that of FEC with
K
=
K
max
. However, beyond a certain number
of redundancies, the system MTTF levels off. This implies that for PRT with a given
K
min
,
there is an
upper limit
on the achievable system MTTF even if we increase
K
max
indefinitely.
Beyond that limit any additional redundancies are simply wasted.
Second, the plateau of the curves for PRT is determined by the number of redundancies
actively transmitted -
K
min
, with larger
K
min
resulting in higher achievable system MTTF.
This implies that to achieve a target system MTTF, there is a
lower limit
on
K
min
below which
the required MTTF can never be achieved, regardless of the total number of redundancies
in the system. The key is that the minimum
K
min
required will still be substantially smaller
than the corresponding number of redundancies
K
required to achieve the same systemMTTF
in FEC.
For example, FEC with
K
7 achieves a system MTTF of 10
15
hours. Now consider the
PRT curve in Figure 13.6 with
K
min
=
=
7 the system MTTF, is only 10
14
hours
which is lower than FEC. To increase the system MTTF, we can either increase
K
max
or
increase
K
min
. In this case, increasing
K
max
does not work because the system MTTF levels
off to a plateau below the required system MTTF. However, increasing
K
min
to 3 does not
work either because the resultant system MTTF is still below 10
15
hours. This is expected as
failure detection in PRT incurs a delay in responding to a server failure. Thus, with the same
number of total redundancies
K
2 and
K
max
=
=
K
max
, it must have a lower system MTTF compared to
60%
40%
20%
0
10
20
30
40
50
60
70
80
90
100
Average detection time (s)
MT TF =
MTTF =
10
11
10
11
MT TF =
MTTF =
10
22
10
22
MT TF =
MTTF =
10
32
10
32
MT TF =
MTTF =
10
47
10
47
MT TF =
MTTF =
10
61
10
61
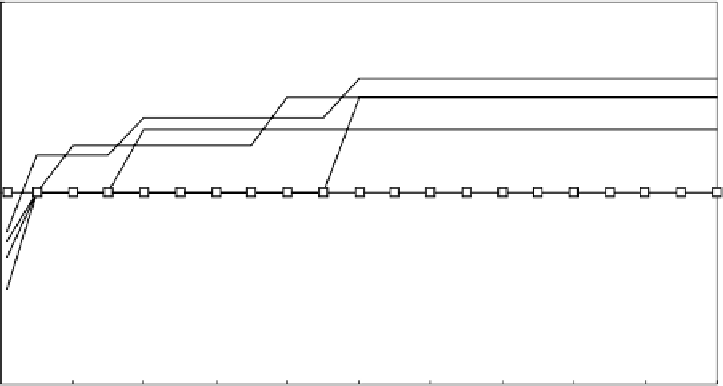
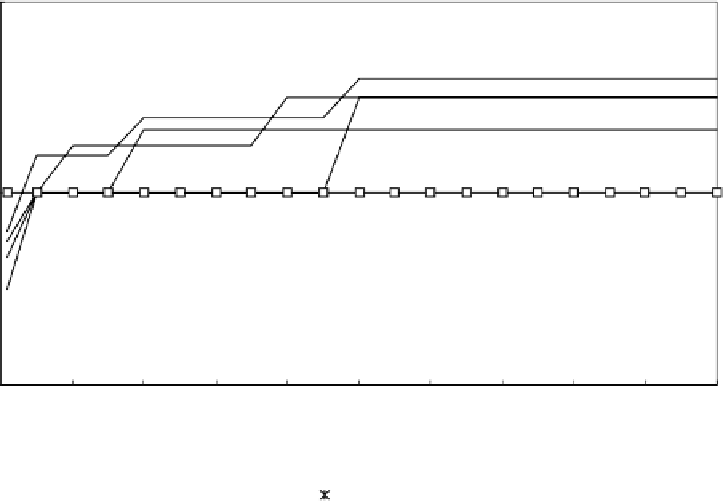
Figure 13.6
Bandwidth ratio (
K
min
/
K
) versus average detection time for 64 servers


Search WWH ::

Custom Search