Geography Reference
In-Depth Information
camera'. In this design, the light that is passed through
a camera's optics is converted to electrical signals at the
back of the camera in a two-dimensional array of sensors.
Often these sensors are designed so that some elements
only respond to certainwavelengths of light, hence the red,
green, and blue light that is measured in a normal digital
camera. More advanced multispectral instruments use a
variety of methods to measure additional wavelengths of
light, including firing several cameras, filtered for different
wavelengths, simultaneously over a target.
Hyperspectral imaging requires a redesign of the way
an instrument collects andmeasures light. The huge num-
ber of wavelengths desired means that splitting light into
dozens of filtered cameras is very unwieldy or impossible.
Instead, two instrument designs are primarily used for
hyperspectral imaging, both quite different from a typical
framing camera. In the
whiskbroom
linear (or cross-track)
array, such as that used in NASA's AVIRIS hyperspectral
instrument, a moving mirror allows light from points on
the ground into the sensor, where a diffraction grating
is used to spread out the spectrum of colours onto a
linear array of detectors that record the intensity of light
in different wavelengths. The number of array elements
becomes the number of wavelengths measured by the
detector, and therefore the number of channels generated
through the imaging. Basically, each instantaneous mea-
surement yields a spectrum for one place on the ground.
The spatial pattern of the data collection is a zig-zag
pattern perpendicular to the plane's flight path, with the
forward movement of the plane yielding another spatial
dimension of data. The zig-zags are then converted to
two-dimensional images through a spatial discretisation
process, and the various spectra collected at each instant
are converted to brightness values in different layers. The
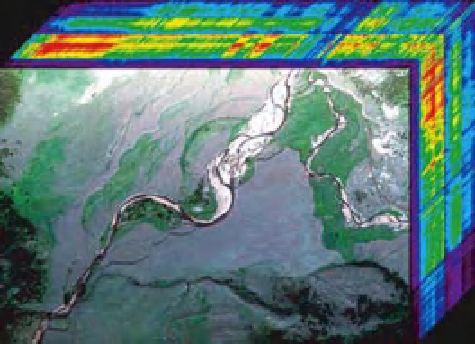
resulting product is known as a hyperspectral datacube
(Figure 4.2a). Whiskbroom sensors have the advantage
of having one detector measuring the intensity of the
dispersed radiation; therefore quantitative comparisons
between pixels are relatively simple. The disadvantage is
that the complex movement of the mirror coupled with
the complex movements of the airplane can induce non-
uniform mapping that can make spatial measurements
problematic without tight geometric control.
The other hyperspectral design commonly used is
known as a
pushbroom
(or along-track) array. Instead
of a moving mirror, a narrow slit oriented perpendicular
to the flight path allows light into the instrument. The light
is scattered into various wavelengths through a diffrac-
tion grating, and the resulting two-dimensional dataset
(one dimension of space, one-dimension of spectra) falls
(a)
450
400
350
300
250
200
150
100
50
0
400
700
1000 1300 1600
Wavelength (nm)
1900 2200 2500
edz
hgr
Igr
pools
rwrun
runs
glides
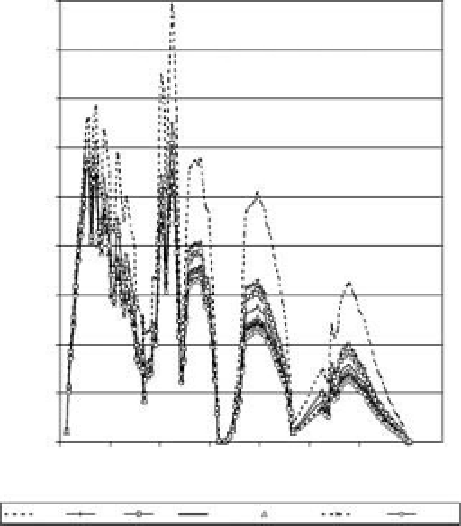
(b)
Figure 4.2
(a) A hyperspectral datacube (from the Probe-1
instrument) showing a true colour image on the top of the
stack, and the various wavelength images along the sides,
(b) example spectra from various fluvial biotype features
including eddy drop zones (edz), high gradient riffles (hgr), low
gradient riffles (lgr), rough water runs (rwrun), as well as pools,
runs, and glides. (b) Reproduced with permission fromMarcus,
W.A. (2002) Mapping of stream microhabitats with high spatial
resolution hyperspectral imagery. Journal of Geographical
Systems, 4, 113-126.
upon a two-dimensional CCD array, which records the
data. Sequential frames build up a dataset of cross-track,
along-track and spectral information. These data are then
reprocessed into hyperspectral images with many wave-
length bands by aligning and merging successive image
Search WWH ::

Custom Search