Geography Reference
In-Depth Information
reasonably well may be in the neighbourhood of 6 - 10
bands (perhaps). The actual number is based on how
spectral unique the various feature classes are and how
these unique modes line up with specific bands. With
only three bands, it becomes more and more difficult
to separate these six categories using three colour bands
alone. With 128 bands from one particular hyperspectral
system, however, a researcher is freed from having to
limit the number of 'categories' or 'units' because of the
band quantity limitation. Instead, decisions about cate-
gorisation potentially can be made based on a physical,
functional role, rather than a technical limitation. Maybe
this river truly has 18 functional habitats, and wouldn't it
be nice if we had so much data that we could pull these
18 classes out almost automatically? On the flip side,
many hyperspectral bands covary with one another to a
large degree; there is a large amount of data redundancy
in many hyperspectral images of river environments. It
is therefore not possible to really treat these example
128 bands as truly separate 128 pieces of information;
their true 'data dimensionality' is less than 128 bands
would suggest.
This chapter is organised into four sections. The first
describes the nature of hyperspectral data, how it is
collected, and how hyperspectral data are related to
river environments. The second section discusses some
of the advantages of hyperspectral imagery compared
with other types of remote sensing in the assessment of
rivers. The third section discusses many of the logisti-
cal and optical limitations of hyperspectral imagery that
may hinder its use in applied river management. The
fourth main section looks at some of the image process-
ing techniques used to extract river information from
hyperspectral data.
came much later. Spectroscopy remains a vital tool in
ground-based and spaceborne astronomy.
Imaging spectrometry as an earth observation tool
began in earnest in the mid-1980s (Goetz et al., 1985).
The AIS (Airborne Imaging System) developed by NASA
in 1983was the first to be used fromhigh-altitude airborne
platforms. The first research quality 'workhorse' hyper-
spectral sensor is known as AVIRIS (Figure 4.1), Airborne
Visible Infrared Imaging Spectrometer (Green, 1994),
which is still in current use. Many similar such airborne
instruments such as CASI (Compact Airborne Spectro-
graphic Imager) and HyMAP (Hyperspectral Mapper)
now are operational in both private and public realms.
The lower spatial resolution that normally is required in
order to increase the spectral resolution of instruments
has hampered spaceborne hyperspectral development.
Today, the Hyperion spaceborne instrument on NASA's
EO-1 satellite has 220 spectral bands and 30m resolution.
It is currently the only true spaceborne hyperspectral
instrument, and it is a prototype mission with a limited
operational lifetime.
Normal multispectral imaging instruments, such as a
digital camera or the Quickbird spaceborne instrument,
often are designed in a fashion known as a 'framing
4.2 The nature of hyperspectral data
Spectrometers have been used as part of remote sensing
for more than a century. In astronomy, for example,
light collected from distant planets, stars, and galaxies
with a telescope was dispersed into constituent wave-
lengths with a prism or diffraction grating. Dark lines that
appeared at specific wavelengths were signatures of atoms
or molecules. These early users of optical spectrometry
were not seeing true hyperspectral imagery, however; the
spectrometer was yielding a one-dimensional spectrum
from only one portion of the telescope's field of vision.
Imaging spectroscopy, the collection of simultaneous
images, one for each of many different wavelengths,
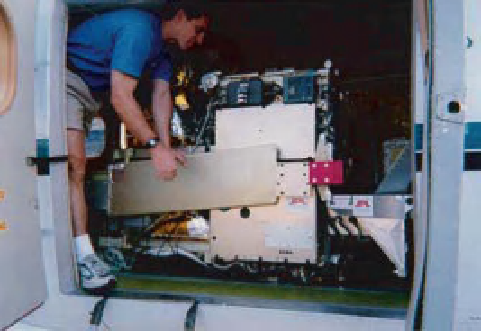
Figure 4.1
The upper portion shows the AVIRIS sensor aboard
a twin-engine Otter airplane on its way to image portions of
Yellowstone National Park; the lower image is a closeup of the
sensor system.


Search WWH ::

Custom Search