Geography Reference
In-Depth Information
area. EPT richness was a function of lowland, stream
power, percent agriculture and percent development.
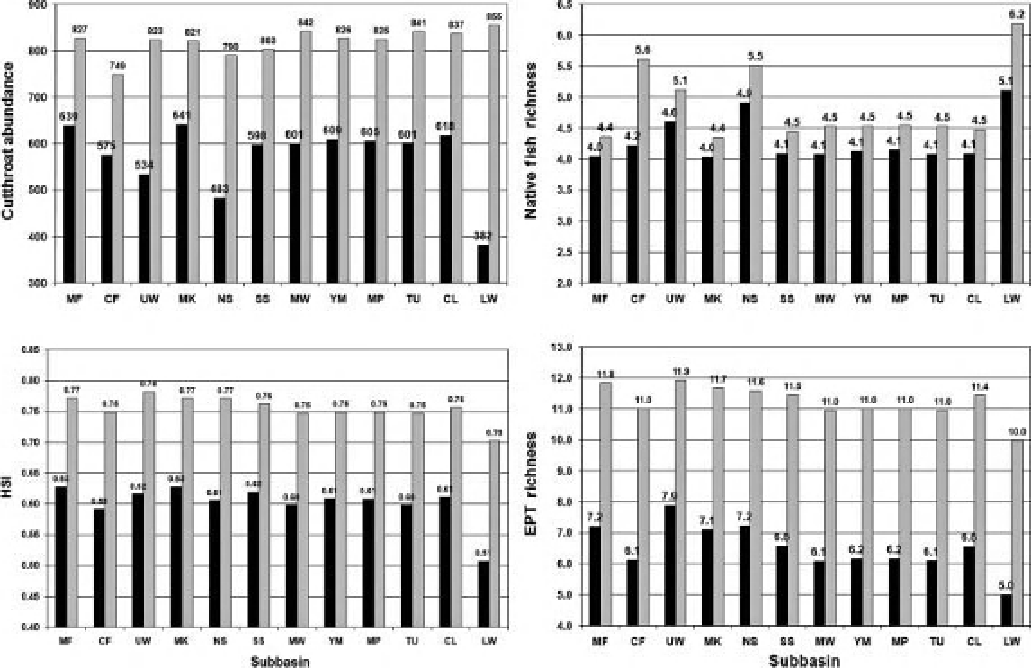
All subbasins exhibited substantial declines on aquatic
HSI (Figure 12.6), with the greatest decreases in the lower
Willamette River subbasin near the Portland Metropoli-
tan area. This portion of the WRB contains the highest
population density of any subbasin and has experienced
extensive land conversion. The model of average native
fish richness in the subbasins projected fewer native
species per stream reach under current landscape con-
ditions than would have been expected in 1850 based
on habitat conditions (Figure 12.6c). Greater native fish
richness was projected in the lower Willamette River
subbasin, but substantial declines also were noted in
some of the upper subbasins, such as the Coast Fork of
the Willamette and North Santiam River (Figure 12.6b).
These same overall patterns were observed in estimates
of
these three subbasins exhibiting the greatest propor-
tional decreases in trout abundance (Figure 12.6a). The
lower Willamette River subbasin exhibited the greatest
projected decline in cutthroat trout abundance, which
is consistent with recent fish surveys. Though cutthroat
trout were widespread in the lower Willamette River
subbasin historically, recent surveys find almost no cut-
throat trout in the mainstem Willamette River (Tom
Friesen, Oregon Department of Fish & Wildlife, personal;
communication; field sampling by Gregory) and low
abundances in small tributaries of the subbasin. Aquatic
macroinvertebrates show even greater relative declines in
EPT richness (Figure 12.6d). The EPT orders - mayflies,
stoneflies, caddisflies - require high water quality, sub-
strate quality, and habitat complexity. Differences in
habitats determined by remotely sensed land cover and
land use cause the relative abundances of EPT species to
be inherently greater in some subbasins, but all subbasins
cutthroat
trout
abundance
per
1-km
reach,
with
(a)
(b)
(c)
(d)
Figure 12.6
Responses of aquatic communities in the 12 major subbasins within the WRB. Grey bars represent values for ca. 1850
and black bars represent conditions in 1990. MF - Middle Fork Willamette, 3 533 km
2
; CF - Coast Fork, 1 725 km
2
;UW-Upper
Willamette, 4 839 km
2
; NS - North Santiam, 2 012 km
2
; SS - South Santiam, 2 696 km
2
; MW - Middle Willamette, 1 807 km
2
;
YM - Yamhill, 1 998 km
2
; MP - Mololla and Pudding, 2 272 km
2
; TU - Tualatin, 1 837 km
2
; CL - Clackamas, 2 436 km
2
;
LW - Lower Willamette, 1107. See Figure 12.5 for map.
Search WWH ::

Custom Search