Geography Reference
In-Depth Information
in the WRB have projected declines in EPT richness of
approximately 40%. Again the lower Willamette River
subbasin exhibited the greatest proportional decline and
lowest projected EPT richness.
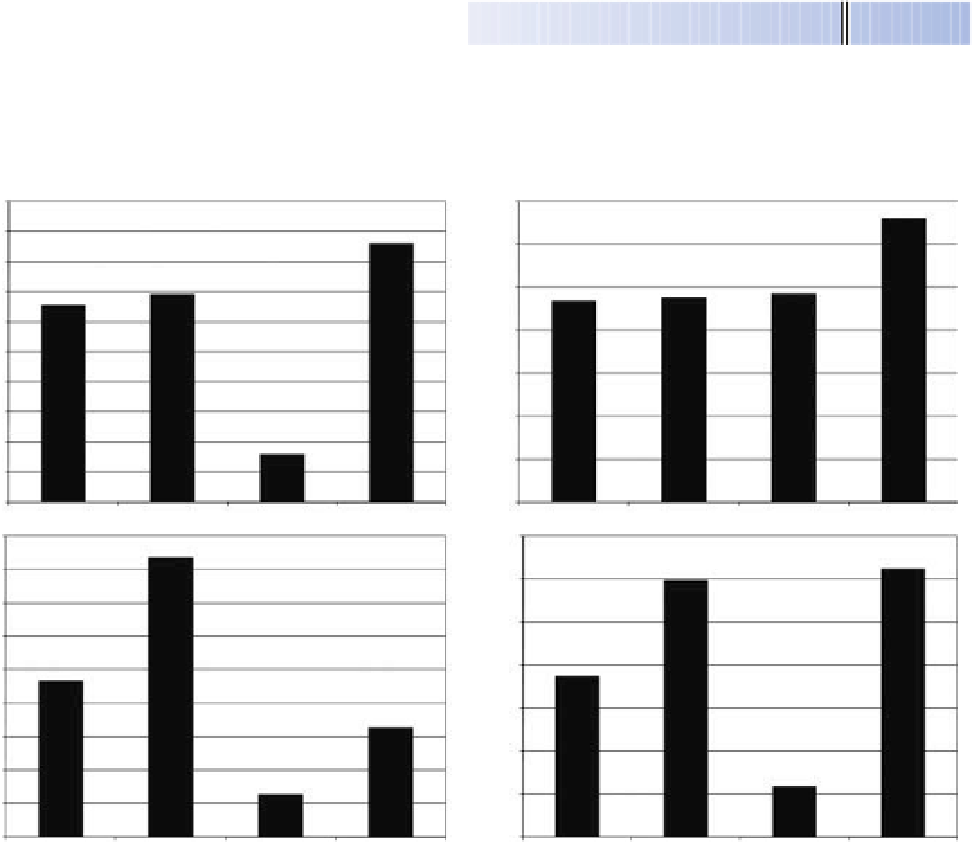
The spatial responses of aquatic communities and habi-
tat characteristics can also be illustrated and contrasted
between the lowland and upland regions of the WRB.
HSI values for habitat conditions for cutthroat trout in
1850 were similar in uplands and lowlands (Figure 12.7d),
which is consistent with cutthroat trout being distributed
throughout lowland streams in the early to mid-twentieth
century (Dimick and Merrifield, 1945). By 1990, habitat
quality for cutthroat trout declined in both lowland and
uplands, though the decrease in potential habitat quality
was greater in the lowlands where land conversion was
more extensive. Potential delivery of wood to streams and
contribution to complex aquatic habitat was much greater
in the more forested uplands where riparian areas were
almost completely made up of older coniferous forests
(Figure 12.7c). Loss of riparian and floodplain forests
described earlier account for the reduction of potential
wood delivery by more than 30% in the lowlands and by
15% in the uplands. This loss of sources of large wood
was responsible for a portion of the loss of complex
habitat in the WRB. Reflecting these changes in habitat
quality and sources of large wood for streams and rivers,
the models projected reductions in cutthroat trout abun-
dance in the lowlands of the WRB of more than 80%, but
projected abundance reduced only slightly in the uplands
(Figure 12.7a). Native fish richness also exhibited much
higher diversity in the lowlands and much greater reduc-
tions in this portion of the basin where land conversion
and habitat modification has been more substantial.
12.8 Discussion
This chapter explores the role of an empirically-based con-
ceptual framework based on remotely sensed landscape
information for tracking change over space and time in
1000
7.0
6.60
900
859
6.0
800
690
4.85
5.0
4.77
700
4.67
654
600
4.0
500
3.0
400
300
2.0
200
158
1.0
100
0
0.0
(a)
(b)
90
0.80
83.6
0.76
80
0.75
0.75
70
0.70
60
0.65
0.64
50
46.7
40
0.60
32.8
30
0.55
20
0.51
12.6
0.50
10
0
0.45
1990 Upland
1850 Upland
1990 Valley
1850 Valley
1990 Upland
1850 Upland
1990 Valley
1850 Valley
(c)
(d)
Figure 12.7
Responses of aquatic communities in the valley (Willamette Valley Ecoregion) and uplands (Cascade Mountain and
Coast Range Ecoregion) of the WRB.

Search WWH ::

Custom Search