Environmental Engineering Reference
In-Depth Information
Table 2
Correlations without drift
q
Crude oil
Gasoline
Diesel
Crude Oil
1.0000
0.5895
0.7744
Gasoline
0.5895
1.0000
0.6789
Diesel
0.7744
0.6789
1.0000
Table 3
Correlations with drift
q
Crude Oil
Gasoline
Diesel
Crude oil
1.0000
0.5872
0.7722
Gasoline
0.5872
1.0000
0.6786
Diesel
0.7722
0.6786
1.0000
Similar approaches can be taken to calculate correlations. If the calculations are
based on
R
t
gures shown in Table
2
are obtained. If the residues are used, those
shown in Table
3
are obtained.
As can be seen, the differences between the results given by the two methods are
minimal here too.
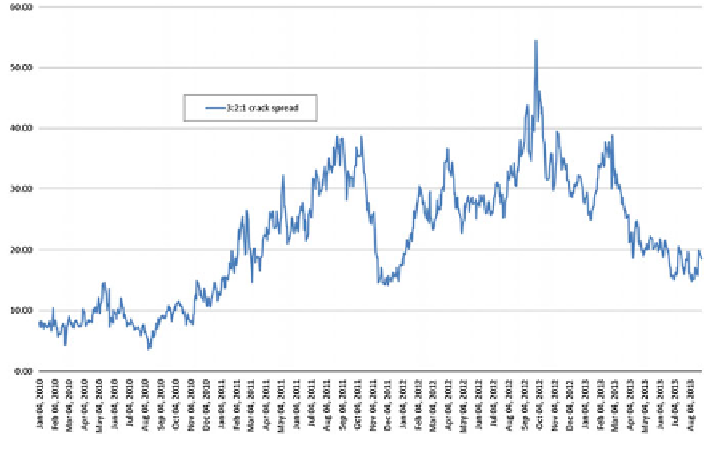
With the market data the historical values of a 3:2:1 crack spread can be cal-
culated. The result is shown in Fig.
2
.
Volatility can be estimated for an IGBM model, resulting in
r
IGBM
¼
the
1
7155.
:
Observe that in this case
r
IGBM
S
t
;
appears in the stochastic component of the dif-
ferential equation, which prevents negative values from being obtained. In the case
studied here, an analysis of Fig.
2
shows that there have been no negative values for
Fig. 2
Historical spot prices for 3:2:1 crack spread


Search WWH ::

Custom Search