Geology Reference
In-Depth Information
Ternary phase diagram with no solid solution
Figure 2.8 shows an example of a ternary phase dia-
gram involving end-members that exhibit no mutual
solid solution. The liquidus forms a 3-dimensional
surface
in this diagram, analogous to the liquidus
curve
in Figure 2.4. The surface takes the form of several
curving 'hillsides' that meet along 'thermal valleys'.
They can be portrayed either by a three-dimensional
model constructed on a triangular base - see the inset
in Figure 2.8 - or by plotting the model in the form of a
two-dimensional 'map' with temperature 'contours'
(isotherms) as shown in the main diagram. Note to
begin with that the left-hand face of the model is equiva-
lent to the Di-An binary phase diagram that has already
been discussed in Figure 2.4, albeit shown here in a
back-to-front sense. In the main diagram the liquidus
surface consists of four sloping fields separated by
gently curved boundaries. Each field represents a
domain of melt composition within which one partic-
ular mineral crystallizes first (analogous to each curved
line in Figure 2.4). The largest field is that in which for-
sterite is this 'liquidus phase'; the fields where diopside
and anorthite crystallize first are significantly smaller.
Consider the course of crystallization followed by
the initial melt composition labelled
x
. If at the outset it
has a temperature above the liquidus (say 1500 °C), the
first stage of its cooling path simply involves cooling
to the liquidus temperature (about 1430 °C). There,
because this composition lies within the forsterite field,
olivine will begin to crystallize (see cartoon (a)). As no
iron is present in this system, the olivine that forms
will be pure forsterite (Mg
2
SiO
4
). Separating out forst-
erite in crystalline form depletes the remaining melt in
the Mg
2
SiO
4
component, a fact that we can represent on
this diagram by drawing a line (dashed) from the
Mg
2
SiO
4
apex to the co-ordinates of
x
, then extending it
beyond
x
(solid arrow). As cooling continues, the melt
composition will migrate along this arrow, directly
away from the forsterite apex. Eventually it reaches the
boundary between the forsterite and diopside fields in
Figure 2.8. At this boundary, called a
cotectic
, diopside
begins to crystallize alongside forsterite. The crystal-
line extract that is removed from the melt from this
point on will be a
mixture
of Di and Fo as in cartoon (b),
the composition of which must lie somewhere on the
bottom edge of the diagram (the domain of An-free Di-
Fo mixtures), and extracting it will therefore drive the
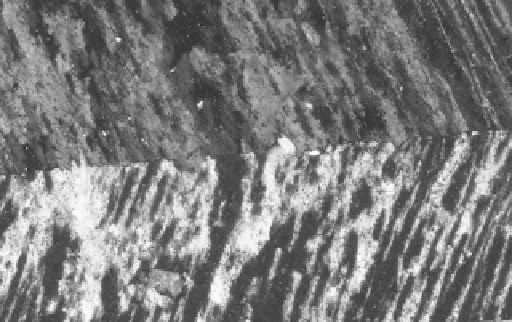
Figure 2.7
Part of a
twinned
crystal of
perthite
(orthoclase
host enclosing darker
exsolution
lamellae of albite) seen
under a polarizing microscope with crossed polars; width
of field ~ 0.7 mm.
Application of the condensed phase rule (because
P
HO
2
is constant) to Figure 2.6b indicates that the sub-
solvus region is a
univariant area
. In favourable cir-
cumstances, coexisting alkali feldspar (or pyroxene)
compositions can be used to estimate the temperature
of equilibration, a fact that has practical application in
geothermometry
.
Ternary phase diagrams
Merely to represent the range of compositions possible
in a three-component system requires the use of the
two dimensions of a piece of paper (Box 2.7). If we
wish to represent comprehensively the phase relations
of such a system over a range of temperature (in a form
analogous to Figure 2.4), we would need to build a
three-dimensional model. However, as a means of
disseminating phase equilibrium data, such models
would be less than convenient, so petrologists have
devised various ways of condensing their content into
two-dimensional form that can be printed on a page.
Examples are shown in Figures 2.8 and 2.9, both of
which relate to the crystallization of simple silicate
melts, that is, to laboratory analogues of magmatic
systems.
The base of any ternary phase diagram is an equilat-
eral triangle, in which any composition in a ternary
system can be plotted (Box 2.7). The temperature axis
of the hypothetical model is constructed perpendicular
to the plane of this triangle (see inset to Figure 2.8).


Search WWH ::

Custom Search