Information Technology Reference
In-Depth Information
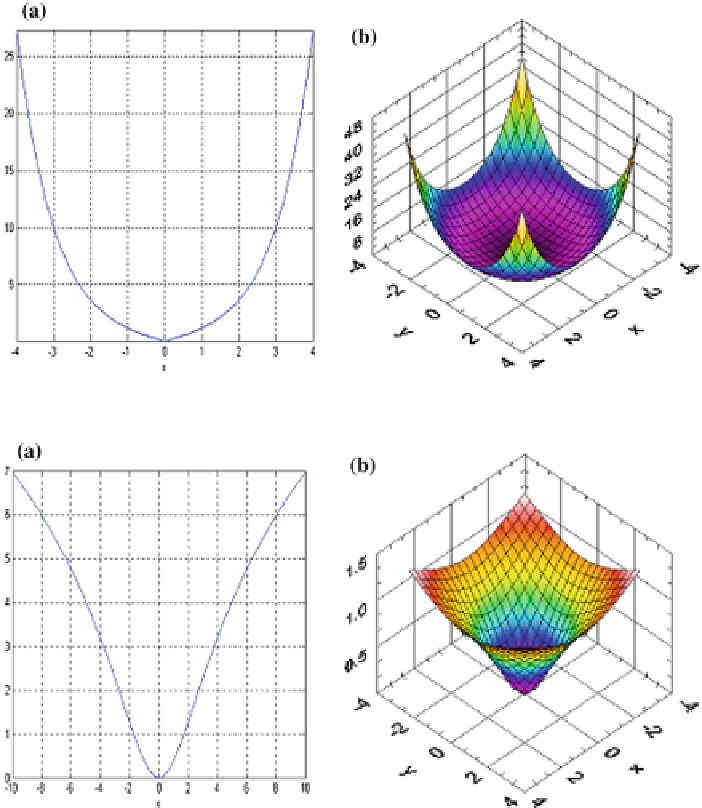
Fig. 3.11
a
Plane and
b
Surface graphs for sinh error function
Fig. 3.12
a
Plane and
b
Surface graphs for Cauchy error function
where
n
is the number of outputs and c is the tuning constant. The plane and surface
plots of Cauchy EF are given in Fig.
3.12
a and b respectively.
3.3.2.8 Huber Error Function
When dealing with noisy data, the training values may contain outliers with unusual
deviation from the true underlying function. Huber function can be used to ignore
these outliers, or at least reduce the ill effect they have on learning. The function
Search WWH ::

Custom Search