Information Technology Reference
In-Depth Information
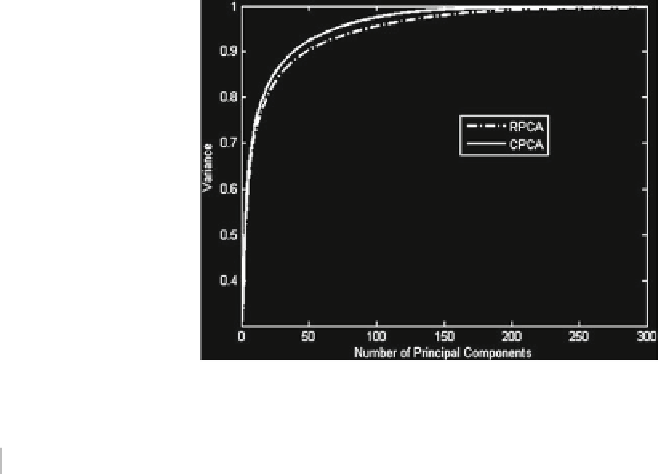
Fig. 7.10
Graph of variance
captured by each principal
component of Indian face
database
Table 7.2
Comparison of training and testing performance for Indian face dataset with different
feature extraction techniques and different neuron architectures
S.no. Neuron
Network Parameters Feature
Average FRR FAR
Recognition
type
extraction
epochs
rate (%)
1
R
MLP
60-8-1
50
×
497
R
PCA
45,000
0.19
0.055
93.8
R
ICA
25,000
0.17
0.045
95.3
R
PCA
30,000
0.20
0.044
95.0
2
C
MLP
60-3-1
50
×
187
C
PCA
30,000
0.21
0.046
94.8
R
ICA
10,000
0.17
0.040
95.5
C
ICA
10,000
0.17
0.035
96.6
R
PCA
30,000
0.19
0.047
94.8
×
3
C
RPN
60-2-1
50
125
C
PCA
30,000
0.20
0.047
94.8
(
d
=
0
.
94)
R
ICA
10,000
0.19
0.045
95.2
C
ICA
10,000
0.18
0.037
96.1
R
PCA
20,000
0.17
0.042
95.3
4
C
RSS
60-1
50
×
123
C
PCA
20,000
0.18
0.046
95.0
R
ICA
10,000
0.20
0.041
95.5
C
ICA
10,000
0.16
0.029
96.8
R
PCA
20,000
0.15
0.041
95.4
5
C
RSP
60-1
50
×
123
C
PCA
20,000
0.16
0.043
95.2
R
ICA
10,000
0.20
0.037
95.9
C
ICA
10,000
0.17
0.025
97.2
From extensive simulations on this face dataset, it is imperative to make following
inferences:
•
Class distinctiveness is very poor in case of
R
PCA
and
C
PCA
.


Search WWH ::

Custom Search