Environmental Engineering Reference
In-Depth Information
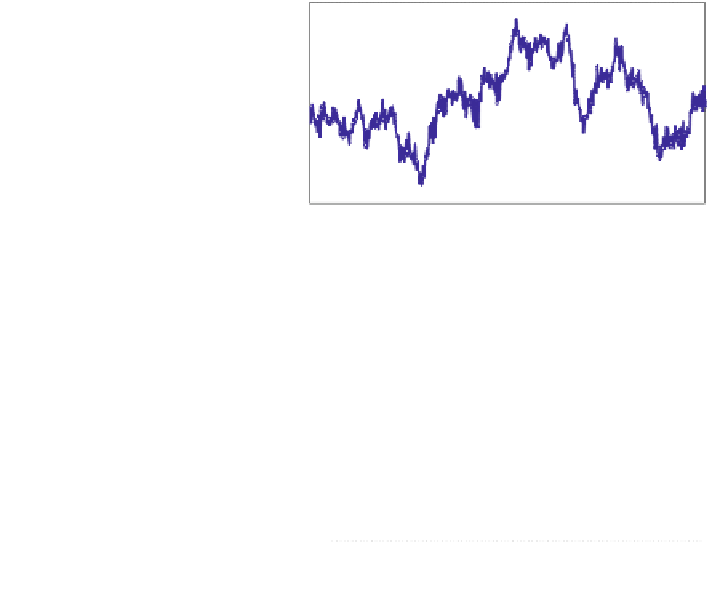
Fig. 1.12
Wind speed (m/s)
24
22
20
18
16
14
12
10
8
6
4
0
50
100
150
200
250
300
Time(sec)
Fig. 1.13 Voltage observed
at the PCC due to the wind
speed variation
1.16
1.155
1.15
Mode2
1.145
1.14
1.135
Mode1
1.13
1.125
0
50
100
150
200
250
300
Time(sec)
Fig. 1.14 Active and
reactive power from WF to
PCC for wind speed variation
Active power from WF to PCC(pu)
4.2
3.
4
3.6
3.4
3.2
2.
3
2.6
2.4
2.2
Reactive power from WF to PCC(pu)
0.45
0.4
0.35
0.3
0.25
0.2
0.15
0.1
0.05
0
0
50
100
150
200
250
300
Time(sec)