Environmental Engineering Reference
In-Depth Information
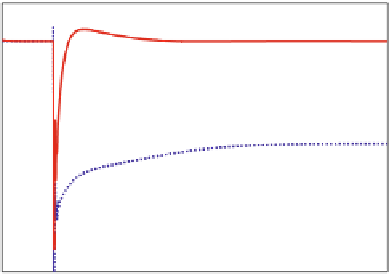
Fig. 1.15 Voltage observed
at the PCC due to the 20 %
impedance decrease
1.14
Mode2
1.12
1.1
Mode1
1.08
1.06
1.04
0
0.5
1
1.5
Time(sec)
and reactive power from the WF to the PCC (see Fig.
1.1
). The reactive power
contribution from the WTs is the difference between Mode 1 and Mode 2.
1.4.2 Local-Load Variation
For this study, the local-load impedance is decreased by 20 % with wind speed
12 m/s. The comparison of the voltage transients observed at the PCC is shown in
Fig.
1.15
. As can be noticed, when Mode 1 was in operation, the load impedance
changes resulted in a noticeable drop in the bus voltage by 4.5 % which does not
satisfy the permissible voltage range ±2 %. When the WT operated in Mode 2, the
voltage recovery to its predefined value was achieved. Thus, the performance in
Mode 2 operation has been significantly improved at the PCC from Mode 1
operation. Figure
1.16
shows the measured data of the active power and the
reactive power from the WF to the PCC. The reactive power contribution from the
WTs is the difference between Mode 2 and Mode 1.
1.4.3 Voltage Sag in the Infinite Bus
To emulate this scenario, it is assumed that there was a fault at t
¼
0
:
5sin the
network that caused a 10 % voltage drop at the infinite bus. The wind speed is also
12 m/s. As can be noted in Fig.
1.17
, Mode 1 operation showed the significant
voltage drop by 14.5 %, while Mode 2 operation resulted in the voltage recovery
to its predefined voltage at the PCC. Figure
1.18
shows the measured data of the
active and reactive power from WF to the PCC.